DLR Institute of System Dynamics and Control Terramechanics Robotics Locomotion Lab
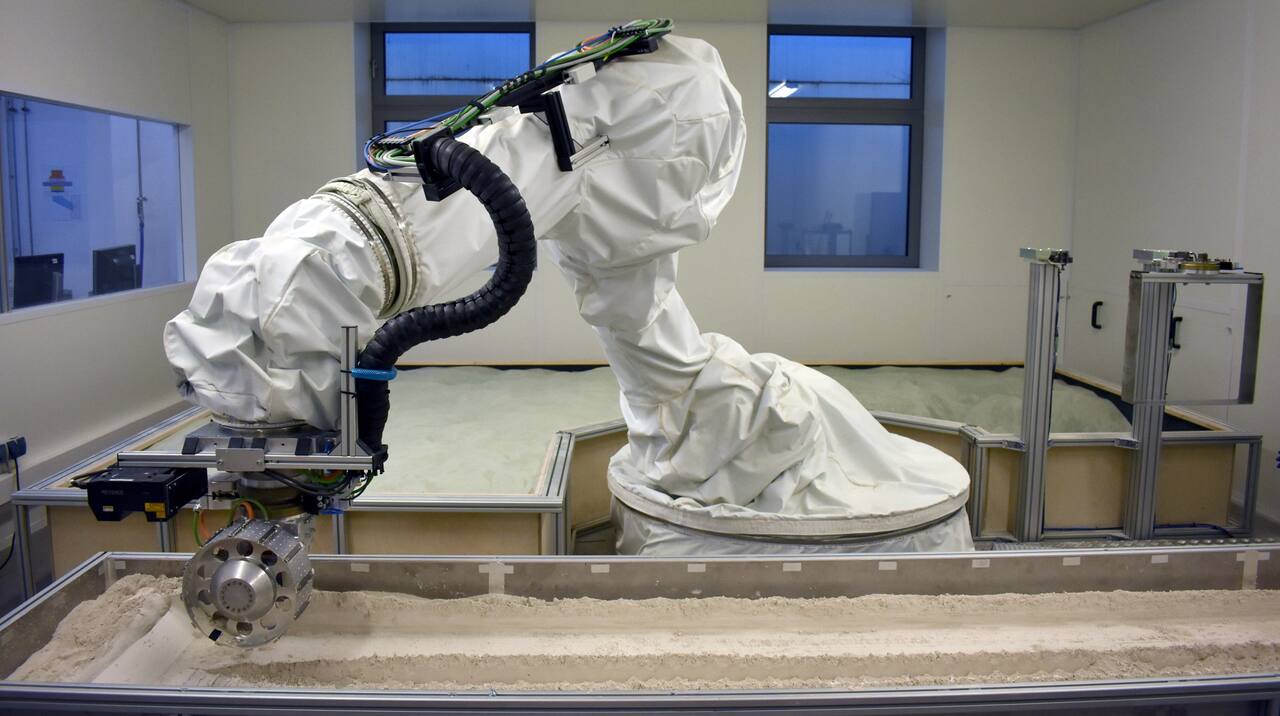
DLR [5]. CC BY-NC-ND 3.0.
TROLL is a single wheel terramechanics laboratory built around a force-controlled industrial robot rather than a rail carriage. The arm holds the wheel against the soil at a commanded vertical load, imposes a commanded slip, side-slip and tilt, and, through an automated tool changer, swaps the wheel drive unit for a soil preparation tool between runs [1][2]. The consequence is throughput: 115 tests in three days by one person, against several weeks for the same matrix on a conventional manual bench.
Most single wheel rigs elsewhere impose the vertical load with a counterweighted slider on a rail rather than a robot arm. Tohoku University’s testbeds recover rut geometry from LiDAR scans of the surface after each pass [7] and compare wheel performance across simulants of different cohesion [8], and Carnegie Mellon’s soil-imaging rig held its test wheel on a similarly weighted vertical axis to isolate the shear mechanism grousers add [9]. TROLL replaces that slider with a commanded force set point on every axis, trading a fixed load path for one the operator can change between runs without touching the rig, which is the design choice that lets one bench sweep load, slip, side-slip and tilt in a single unattended matrix.
It is at Oberpfaffenhofen-Wessling in Bavaria, and belongs to the Institute of System Dynamics and Control, which is a different DLR institute from the Institute of Space Systems in Bremen that runs the landing rig, and a different one again from the neighboring Institute of Robotics and Mechatronics on the same campus.
Where single wheel testing sits in the design space
Section titled “Where single wheel testing sits in the design space”Wheel-soil testing has to produce traction, sinkage and rolling resistance numbers for a wheel that will run on a soil nobody can bring to the laboratory, at a gravity the laboratory does not have. The approaches that have been used fall into five families, and TROLL belongs to only one of them.
Empirical and dimensional-analysis data sets. The Waterways Experiment Station collected the published wheel-on-soft-soil data into one volume and reduced performance to dimensionless groups built on cone index [13]. The same school produced the Apollo-era single-wheel dynamometer programs on the lunar roving vehicle wheel: wire-mesh wheel variants in crushed basalt simulant at four consistencies [15], and a parametric follow-on finding that pull coefficient and efficiency do not depend on wheel speed from 0.44 to 3.14 m/s or on load from 178 to 377 N, while soil strength does [16]. These are ground tests of a flight-configuration wheel in a terrestrial simulant at 1 g, in air.
Analytical stress-distribution and Bekker-type models. Wong and Reece located the stress transition point under a towed rigid wheel analytically [14]. Later work extends that family to steering side force on loose soil [28], wheel diameter and width dependence of pressure-sinkage in sand [31] and grouser-induced oscillation in sinkage and drawbar pull [32]. All three are validated on laboratory sand or lunar simulant at 1 g, and the parameters are fit per soil. Single wheel rigs such as TROLL exist largely to supply the measurements these models are fit to.
Instrumented single wheel and tool testbeds. This is TROLL’s family. An earlier DLR terramechanics bench at the same site used a 5.5 by 10 by 0.5 m soil bin with a camera elevation mapper, an infrared optical tracker and a purpose-built tripod bevameter to validate a multibody wheel-soil model for ExoMars; its identified Bekker cohesive modulus came out negative for all three soils, outside any ordinary range [17]. TROLL’s commanded-force robot replaced that bench’s manual workflow with the automated preparation and 4 ms force loop described below [1][4]. Outside space work, a wheel force transducer rig on a 5.2 tonne military vehicle measures drawbar pull and slip dynamically on soft ground [24]; it is terrestrial automotive testing at a scale far from rover wheels, and is included because it shows the transducer-on-the-hub approach carried to full size.
Soil flow visualization and discrete element simulation. The Shear Interface Imaging Analysis Tool at Carnegie Mellon runs a half-width wheel against a glass wall in GRC-1 simulant and maps soil flow with optical flow, finding the shear interface largely set by rim tangential stress [20]. The same group’s grouser spacing equation, a geometric rule that the next grouser must engage before the rim, rests on those images but was verified at a single 20 percent slip on one wheel radius [23]. Two-dimensional discrete element models selected lug geometry for a SELENE-2 micro rover wheel, a 250 mm rim with 18 lugs, on a sloped bed of FJS-1 simulant [18]. These methods give mechanism and design guidance; TROLL does not image the soil beneath the wheel.
Reduced-gravity experiments. Parabolic flight is the route to wheel data at 1/6 g. A thesis validated a parallel-particle discrete element method against parabolic-flight single wheel runs in ES-2 simulant at Earth, Martian and lunar gravity, and did not reach quantitative agreement: drawbar pull to weight was about 45 percent low when sinkage was matched [25]. A later parabolic-flight study tested whether matching the cone index gradient of a simulant to Apollo in-situ data also matches wheel behavior, and had only the 1/6 g wheel runs in hand at publication [27]. Granular scaling laws for grousered and helical wheels were checked in silica sand and BP-1 at 1 g and then in simulated lunar gravity, with no physical reduced-gravity data [26]. None of these is a facility-scale installation; all are experiments or models, and TROLL has no counterpart to them.
Flown systems. The flight record of wheel-soil knowledge is the rover itself. Curiosity’s traction control commands idealized no-slip wheel rates at 8 Hz from proprioceptive sensing and has 483 sols of flight results; its ground validation used the Scarecrow test rover and the VSTB, and the flight comparison is between different terrains because the rover has no wheel load sensors [29]. Single wheel benches supply the pre-flight characterization and none of the published TROLL campaigns is a flight qualification.
Simulants
Section titled “Simulants”The wheel-soil result depends on the soil, and the soils are themselves a standardization problem. The Apollo experience of rover slip and sinkage drove the 2005 NASA simulant workshop and the root and derivative simulant framework it set [30]. GRC-1 was designed to reproduce the cone index gradient measured in situ by Apollo 15 and 16 and matches frictional response but not cohesion [19]. For ExoMars the three UK testbed simulants ES-1, ES-2 and ES-3 were selected on particle size and density against Viking, Pathfinder, MER and Phoenix data [22]; their direct shear and pressure-sinkage characterization found that the achieved densities and the resulting cohesion and friction angle miss the ExoMars specification, with compacted ES-1 at 3.9 kPa cohesion against a 0.5 to 2.0 kPa specification [21]. TROLL’s DLR-RMCS13 and RMCS14 are the DLR counterparts, and their tie to the cone index gradient or to measured Martian soil is not published in the sources held.
Laboratory data
Section titled “Laboratory data”| Parameter | Value |
|---|---|
| Operator | DLR Institute of System Dynamics and Control [3] |
| Location | Oberpfaffenhofen-Wessling, Germany [5] |
| Commissioned | First facility paper 2018; “recently developed” in 2019 [1][2] |
| Type | Robot-based single wheel soil bin, force controlled |
| Floor area | Not published. Design envelope 6.5 x 6.5 x 3.5 m |
| Capabilities | Single wheel bench, soil preparation tool, soil bins |
| Simulant or terrain | DLR-RMCS13 chalk silt; DLR-RMCS14 olivine sand [2][3] |
| Instrumentation | ATI Omega160 force-torque sensor above the tool changer [1] |
| Ground truth | Penetrometer at 10 points along the lane, to 0.2 m [2] |
| Fidelity limits | 1 g; usable lane about 3 m of 4 m [1][2] |
| Access | Institute-run; no published external user program [2] |
| Cited by | rosalind-franklin |
Capabilities
Section titled “Capabilities”Single wheel bench
Section titled “Single wheel bench”| Parameter | Value |
|---|---|
| Working volume | Lane 4 m long, about 3 m usable, wheels to 200 mm wide [1] |
| Test article limits | Wheel load to 1 kN; wheel radius 80 to 250 mm [1][5] |
| Vacuum | Not applicable. Ambient pressure, enclosed hall |
| Temperature | Monitored, not set: 24.5 to 26.5 C [2] |
| Illumination | Not applicable. No solar simulator |
| Simulant or terrain | DLR-RMCS13 and DLR-RMCS14, tonnage not published |
| Slope | Side-slip 0 to 15 degrees instead [1] |
| Gravity offload | None. Vertical load commanded, 50 N and up [1][2] |
| Instrumentation | ATI Omega160 force-torque sensor; two Keyence LJ-7300 |
The machine is a KUKA KR210 R3100 Ultra inside a dust protective jacket, standing between a large fixed soil container behind it and a smaller interchangeable container in front, with an automated tool changer at the flange [1]. One tool is the wheel drive unit; the other is the soil preparation tool, and swapping between them is what allows a full test matrix to run unattended.
Force control is the design idea. Each Cartesian axis is either force controlled or holonomically constrained, so a run holds a commanded vertical load, a commanded slip ratio and a commanded side-slip and tilt while the wheel traverses the bin [1][3]. That removes the hanging weights and cable winch of the conventional bench and replaces them with a commanded set point, which is why arbitrary combinations of load and slip can be swept automatically [1][4]. Constant load and forced slip are held through the robot’s 4 ms control cycle [2].
The published limits do not fully agree. Wheel radius is 80 to 250 mm in the facility paper [1], while the drive unit is separately described as accepting wheels of 200 to 400 mm diameter [2]; both are recorded here. The servo drive is limited to 28 Nm and 85 rpm, giving 1.1 m/s at a 125 mm radius, and the operator page states a wheel load to 1 kN, a run length up to 3 m and a horizontal speed above 1 m/s [5]. The rig was designed to a 6500 x 6500 x 3500 mm envelope with a 10 kN/m2 floor load allowance for the bins [4]. The lowest loads actually run in the published campaigns are 50 N, chosen “to limit the sinkage over the entire slip range”, and 100 N, described as “representative of a medium-class 6-wheeled rover (mass ~350 kg) under lunar gravity”; the design requirement list goes lower, to 37 N for the LRU rover wheel at lunar gravity.
Soil preparation tool
Section titled “Soil preparation tool”| Parameter | Value |
|---|---|
| Working volume | Full lane; loosening to 250 mm, mixing to about 200 mm [1] |
| Simulant or terrain | Recipe differs per simulant: 3 min sand, about 9 min chalk |
| Instrumentation | Bulk density sampler, plus or minus 2.5 percent relative [3] |
The second tool on the changer prepares the soil, which is why the test matrix can run without an operator in the bin. Preparation is automated in three steps: loosening, leveling and compression [1]. For mechanical loosening the tool is inserted to a depth, tilted to an angle, traversed, reversed to the opposite angle and returned, which counts as one pass; the published recipe for the cohesive simulant is 20 degrees, 250 mm depth, 0.2 m/s, three passes. Pneumatic loosening by fluidization through a floor grid takes 1 to 10 s per pulse, with 5 s stated as good for olivine and quartz sand, but the operators record two disadvantages, “the dust emission and a possible separation of the different grain sizes”, the separation developing “on a time scale of minutes” [1]. Leveling is a 30 degree blade pass at a set height, and compression is repeated vertical presses of 5 to 20 mm for the olivine and 10 to 80 mm for the chalk, with 50 percent overlap described as “a good balance between effort and quality” [1].
Preparation time is asymmetric between the two simulants: about 3 minutes for the olivine sand, using fluidization and two leveling passes, against almost three times longer for the cohesive chalk, which needs mixing, at least four leveling passes at decreasing depths and two compression passes [2].
Relative density is controlled through measured bulk density rather than through a procedure alone. The method uses a purpose-built non-disturbing sampler with a stated plus or minus 2.5 percent relative measurement uncertainty, sampled along the lane before and after preparation [3]. On the conventional DLR bench, from which the method was carried over, the four preparation methods gave densities of 1.11 g/cm3 by manual deep raking, 1.26 by manual board-walk compression, 1.13 by semi-automated plow and 1.26 by semi-automated sled, with root mean square deviations of 1.6 percent, 2.3 percent, 1 percent and 0.5 percent respectively.
Soil bins
Section titled “Soil bins”| Parameter | Value |
|---|---|
| Working volume | Small front bin 4 m long, about 3 m usable; large fixed bin behind [1] |
| Simulant or terrain | RMCS13, 1 to 30 um chalk; RMCS14, 90 to 700 um olivine [2][3] |
| Instrumentation | Penetrometer, 10 points, 0.2 m depth at 0.02 m/s [2] |
There are two containers, a large fixed one behind the robot and a smaller movable one in front, and only the movable one is dimensioned in the literature: 4 m long, taking wheels up to 200 mm wide, of which “due to boundary effects on both sides, the resulting test length is of about 3 m” [1]. Bin depth is not published for either; mechanical loosening reaches 250 mm and sand mixing about 200 mm, so the working depth is at least 0.25 m [1]. Neither tonnage is published.
DLR-RMCS13 is a calcium carbonate powder of 1 to 30 um with rounded ellipsoidal grains that form breakable clusters, cohesive and highly compactable, designed as a worst-case soft soil after Spirit’s embedding: uncompacted it “cannot support the weight of an average person, resulting in knee-deep sinkage”, while compacted “it is even possible to walk on the material without noticeable sinkage” [3]. DLR-RMCS14 is an olivine sand of 90 to 700 um with a friction angle of about 35 degrees, a quartz substitute with no free silica, matched to martian grain size distributions less the silt and clay fractions [2].
Instrumentation
Section titled “Instrumentation”The force-torque sensor does three jobs at once: it measures the wheel forces, it protects the rig against limit violations, and it closes the force control loop [1]. Its IP65 and IP68 rating is a facility choice rather than a sensor choice, because the sensor lives in the dust.
Sinkage is not measured by a displacement transducer on the wheel carrier. It is derived from robot position combined with laser profile scans of the surface taken before and after each run, which the rig reconstructs into a full three-dimensional surface [1]. That gives sinkage, rut geometry and soil displacement from the same measurement. Beyond the force-torque sensor and the two Keyence LJ-7300 scanners, the rig carries an inertial measurement unit, camera mounts, environmental sensors for temperature and for air and soil humidity, and mounting points on the experiment tool for a bevameter and a penetrometer. A Sony NEX-FS700 records 4K at 480 frames per second, and the hall lighting exists to support it rather than to set an illumination level [1].
There is no motion capture volume. Pose comes from the robot’s own telemetry over the KUKA robot sensor interface at a 4 ms cycle [2]. Sampling of the force channels was designed around grouser excitation, at 50 Hz or better against 10 Hz on the previous rig [4].
Soil state is instrumented separately from the wheel. Penetrometer tests are “frequently conducted in ten different spots equally distant from each other to verify that a consistent soil state was achieved”, to 0.2 m depth at 0.02 m/s, plotted against bin position, with transient regions at both ends shaded and their data discarded [2]. An internal consistency check on the 2019 campaign compared a computed grouser strike frequency of 1.193 Hz against 1.19 Hz measured by fast Fourier transform [1].
What it does not reproduce
Section titled “What it does not reproduce”Gravity. The rig scales the wheel load, not the gravitational field. The 100 N case is described as representative of a 350 kg six-wheeled rover under lunar gravity [2], but the soil column, the wheel’s own weight distribution and the granular flow are all at 1 g. For the milli-gravity case DLR’s published position is blunt: “due to large differences between the Phobos and Earth environments, it is almost impossible to perform laboratory experiments to design, develop and validate robotic operations. Thus, simulations are critical” [6].
Whether a 1 g rig can stand in for that difference at all, even by scaling the load, is unsettled elsewhere in the literature [10]. A parabolic-flight comparison that put the same wheel and simulant through both an equal-load 1 g test and true lunar gravity found the 1 g test overstated mobility, drawbar pull to weight fell 20 percent or more and sinkage rose up to 40 percent in true lunar gravity, and traced the gap to a fourfold drop in measured cone index gradient, a soil shear-strength effect that lowering the density of a 1 g simulant does not reproduce [10]. A discrete element study of a lunar wheel-soil model reports the same direction of effect: simulated lunar gravity gave a less visible wheel track and a higher tractive efficiency than the same wheel and soil model run at 1 g [11]. TROLL’s published campaigns do not apply either correction; the 100 N case stands for lunar gravity by matching load alone.
A quarter of its own bin. The soil bin is 4 m long and the usable test length is about 3 m, because of boundary effects at both ends [1]. The 3 m driving distance in the high-speed campaign was chosen “to avoid potential disturbances caused by the front and back walls of the soil bin”, and only the 0.5 to 2.5 m interval is treated as steady state [2].
A disturbance-free carrier. The arm is part of the measurement. The high-speed campaign records “slightly higher vibrations experienced at both ends of the soil bin where the robot arm was fully extended” [2], which is where the arm’s stiffness is lowest and where the end-effects of the bin already apply.
Its own speed and slip limits. The operators are specific about what fails first: “the main controller of the robot arm had to constantly compensate for the rotational speed of the wheel, which proved to be increasingly difficult when higher speeds or higher slip ratios were considered”, and “greater sinkages may have been experienced due to slightly over-imposed slipping conditions resulting from the controller throughput being challenged to keep pace with the motor driver”, alongside “the close approach in several instances to the motor current limit” [2]. The limits bite above about 1 m/s and above 80 percent slip.
Fluidized preparation on cohesive soil. On the cohesive chalk simulant, fluidization “tended to form cylindrical air channels, releasing the air directly outside of the bin and precluding its use” [2], so the fast preparation route is available only for the sand.
The densest achievable soil state, by machine. “The maximum density of the material was not possible to be reached via semi-automated preparation, but by its manual counterpart” [3]. The automated method that makes the throughput possible does not reach the state the manual method reaches.
Homogeneity along the lane. The operators record that “maintaining the soil in a homogeneous state at any given point was crucial and often a challenge” [2], which is why the ten-point penetrometer check exists.
Traction on the cohesive simulant above 0.1 m/s. The high-speed campaign reports complete loss of traction on DLR-RMCS13 above that speed [2].
Vacuum, temperature and illumination. None of the three is provided. The enclosure carries sensors for temperature and for air and soil humidity, used to keep ambient conditions controlled rather than to set them; logged values for the 2019 campaign were 26.5 C and 1.9 percent relative humidity on one simulant and 24.5 C and 3.3 percent on the other [2].
How TROLL compares to other single wheel testbeds
Section titled “How TROLL compares to other single wheel testbeds”The gap between TROLL’s rigid and flexible wheel results widens the same way the design space elsewhere predicts. Tohoku University’s rutting work on a rail-carriage testbed finds that both rut depth and rut incline grow with vertical load [7], and its cohesion comparison finds that the DLR-RMCS13-style cohesive simulant and a sand simulant give systematically different wheel performance under the same testbed [8], which is the same pair of variables, load and cohesion, that TROLL’s own campaigns vary through the soil preparation tool rather than through the load path. Carnegie Mellon’s shear-interface imaging attributes a grousered wheel’s gain over a smooth one to reduced bulldozing resistance at the front of the contact patch rather than added thrust at the rear [9], a distinction TROLL’s force-torque instrumentation records as a net drawbar pull number without separating the two contributions.
Two of the open questions the facility page cannot itself answer already have partial answers elsewhere in the literature. A discrete element model of a lunar wheel-soil system, run at gravities from 1 g to 6 g, finds that raising gravity deepens the wheel track and lowers tractive efficiency [11], which is the mechanism a 1 g test at TROLL cannot access no matter how the load is set. A parabolic-flight thesis that measured the same wheel and soil pair at 1 g and at lunar gravity develops granular scaling laws as a correction for exactly that gap, reporting errors of a few percent on drawbar pull and sinkage once wheel size and speed are rescaled between gravity levels [10], a correction TROLL’s own campaigns do not apply. The flexible wheel geometry both testbeds share traces back to the original ExoMars suspension trade study, whose soil-contact model is the reference against which the wheel’s later single-wheel and breadboard performance was checked [12].
Campaigns run there
Section titled “Campaigns run there”Side-slip in cohesive soil, 2019. A three-dimensionally printed wheel of 160 mm radius and 100 mm width with twelve straight grousers of 10 by 5 mm, on DLR-RMCS13 prepared without compression, at 0.1 m/s and 50 N, sweeping slip from 20 to 80 percent and side-slip angle across 0, 5, 10 and 15 degrees, with three repeats of each condition [1]. The campaign ran 115 tests in three days with one operator, against several weeks for the same matrix on a conventional manual bench, and three identical runs agreed in both traction and sinkage [1].
High speed tractive performance, run 2019 and published 2023. A rigid metallic wheel of 250 mm diameter and 112 mm width with twelve toothed grousers, and the flexible ExoMars and Rosalind Franklin wheel of the same size and grouser design, at 100 N across 0.01 to 1 m/s at 20 and 60 percent slip, over 3 m after a 0.75 s acceleration, on both simulants [2]. Drawbar pull and tractive efficiency fall sharply above 0.2 m/s; peak efficiency drops by 62.5 percent between 0.01 and 1 m/s; the slip at which efficiency peaks migrates from 10 percent to 30 percent; and sinkage rises with speed, against the prior literature. The flexible wheel at 1 m/s gives about twice the drawbar pull and efficiency of the rigid one with 18 percent less sinkage at low slip [2]. That flexible wheel descends from the 3-lobed titanium and steel design the original ExoMars trade study chose over four competing suspension concepts; the same trade study’s soil-contact model, validated against single-wheel tests, carried 20 to 40 percent drawbar pull error for flexible wheels against 20 percent or less for rigid ones [12], the same order of uncertainty the TROLL facility paper admits for its own servo drive figures. The recommended operating band is 0.2 to 0.3 m/s. The campaign happened at TROLL because no conventional rig could reach those speeds: researchers from Tohoku University and ESA “approached the Institute of System Dynamics and Control” for exactly that reason, which is also the only documented external access route [2].
MMX rover. The operators state that “in the future the testbed will be used within the MMX Rover mission context to test, validate and optimize the rovers wheels” [1]. No report of an executed MMX wheel campaign at TROLL is published; the available MMX locomotion paper covers simulation and the milli-gravity technology experiment rather than TROLL runs [6].
What is not established
Section titled “What is not established”Published TROLL results are at 1 g with loads scaled to represent lunar gravity, and the effect of that substitution on drawbar pull and sinkage has not been measured on this rig [10][27]. Bin depth and simulant tonnage are not published. The 0.2 to 0.3 m/s operating band comes from one wheel pair on two simulants [2]. No external user program is documented. The link between DLR-RMCS13 and RMCS14 and the cone index gradient of flown terrain is not stated in the held sources, which is the same property the ExoMars and GRC-1 simulant work used to qualify soils [19][21]. The MMX wheel campaign the operators describe as planned has no published report [1][6].
References
- Buse, F. (2019). Fully Automated Single Wheel Testing with the DLR Terramechanics Robotics Locomotion Lab (TROLL)
. Symposium on Advanced Space Technologies in Robotics and Automation. Source
BibTeX
@inproceedings{buse2019fully, title = {Fully Automated Single Wheel Testing with the {DLR} Terramechanics Robotics Locomotion Lab ({TROLL})}, author = {Buse, Fabian}, booktitle = {Symposium on Advanced Space Technologies in Robotics and Automation}, organization = {European Space Agency}, address = {Noordwijk, The Netherlands}, year = {2019}, url = {https://elib.dlr.de/128404/} } - Rodríguez-Martínez, D., Buse, F., Van Winnendael, M. and Yoshida, K. (2023). The Effects of Increasing Velocity on the Tractive Performance of Planetary Rovers
. arXiv preprint. Source
BibTeX
@article{rodriguezmartinez2023effects, title = {The Effects of Increasing Velocity on the Tractive Performance of Planetary Rovers}, author = {Rodríguez-Martínez, David and Buse, Fabian and Van Winnendael, Michel and Yoshida, Kazuya}, journal = {arXiv preprint}, year = {2023}, doi = {10.48550/arxiv.2306.02167}, abstract = {An emerging paradigm is being embraced in the conceptualization of future planetary exploration missions. Ambitious objectives and increasingly demanding mission constraints stress the importance associated with faster surface mobility. Driving speeds approaching or surpassing 1 m/s have been rarely used and their effect on performance is today unclear. This study presents experimental evidence and preliminary observations on the impact that increasing velocity has on the tractive performance of planetary rovers. Single-wheel driving tests were conducted using two different metallic, grousered wheels-one rigid and one flexible-over two different soils, olivine sand and CaCO3-based silty soil. Experiments were conducted at speeds between 0.01-1 m/s throughout an ample range of slip ratios (5-90%). Three performance metrics were evaluated: drawbar pull coefficient, wheel sinkage, and tractive efficiency. Results showed similar data trends among all the cases investigated. Drawbar pull and tractive efficiency considerably decreased for speeds beyond 0.2 m/s. Wheel sinkage, unlike what published evidence suggested, increased with increasing velocities. The flexible wheel performed the best at 1m/s, exhibiting 2 times higher drawbar pull and efficiency with 18% lower sinkage under low slip conditions. Although similar data trends were obtained, a different wheel-soil interactive behavior was observed when driving over the different soils. Overall, despite the performance reduction experienced at higher velocities, a speed in the range of 0.2-0.3 m/s would enable 5-10 times faster traverses, compared to current rovers driving capability, while only diminishing drawbar pull and efficiency by 7%. The measurements collected and the analysis presented here lay the groundwork for initial stages in the development of new locomotion subsystems for planetary surface exploration. At the same time...} } - Lichtenheldt, R., Burlet, J.-Y., Buse, F. and Rebele, B. (2017). Towards Automated Soil Preparation for Planetary Rovers: Methods for Reproducible Measurements in Regolith Simulants
. Symposium on Advanced Space Technologies in Robotics and Automation. Source
BibTeX
@inproceedings{lichtenheldt2017towards, title = {Towards Automated Soil Preparation for Planetary Rovers: Methods for Reproducible Measurements in Regolith Simulants}, author = {Lichtenheldt, Roy and Burlet, Jean-Yves and Buse, Fabian and Rebele, Bernhard}, booktitle = {Symposium on Advanced Space Technologies in Robotics and Automation}, organization = {European Space Agency}, address = {Leiden, The Netherlands}, year = {2017}, url = {https://elib.dlr.de/112794/} } - Buse, F. (2015). Machbarkeitsstudie für einen roboterbasierten Radprüfstand zur Entwicklung von Mars- und Mondrovern. Source
BibTeX
@mastersthesis{buse2015machbarkeitsstudie, title = {Machbarkeitsstudie für einen roboterbasierten Radprüfstand zur Entwicklung von Mars- und Mondrovern}, author = {Buse, Fabian}, school = {Rheinisch-Westfälische Technische Hochschule Aachen}, type = {Master's thesis}, year = {2015}, url = {https://elib.dlr.de/97400/} } - (2026). DLR: Terramechanics Laboratory TROLL. dlr.de/en/rm/about-us/institute/infrastructure/troll
BibTeX
@misc{dlrtroll, title = {DLR: Terramechanics Laboratory TROLL}, organization = {dlr.de}, year = {2026}, url = {https://www.dlr.de/en/rm/about-us/institute/infrastructure/troll} } - Buse, F., Barthelmes, S., Chalon, M., Langofer, V., Bertleff, W., Lichtenheldt, R., Skibbe, J., Bihler, M., Holderried, R., Reill, J., Vodermayer, B., Stubbig, L., Bertrand, J., Tardivel, S., Vernazza, P., Murdoch, N., Ulamec, S. and Michel, P. (2021). Wheeled Locomotion in Milli-Gravity: A Technology Experiment for the MMX Rover
. International Astronautical Congress, IAC-21,A3,4A,8,x64275. Source
BibTeX
@inproceedings{buse2021wheeled, title = {Wheeled Locomotion in Milli-Gravity: A Technology Experiment for the {MMX} Rover}, author = {Buse, Fabian and Barthelmes, Stefan and Chalon, Maxime and Langofer, Viktor and Bertleff, Wieland and Lichtenheldt, Roy and Skibbe, Juliane and Bihler, Markus and Holderried, Roman and Reill, Josef and Vodermayer, Bernhard and Stubbig, Leon and Bertrand, Jean and Tardivel, Simon and Vernazza, Pierre and Murdoch, Naomi and Ulamec, Stephan and Michel, Patrick}, booktitle = {International Astronautical Congress}, number = {IAC-21,A3,4A,8,x64275}, address = {Dubai, United Arab Emirates}, year = {2021}, url = {https://elib.dlr.de/144876/} } - Takehana, K., Ares, V. E., Santra, S., Uno, K., Rohmer, E. and Yoshida, K. (2025). Rutting Caused by Grouser Wheel of Planetary Rover in Single-Wheel Testbed: LiDAR Topographic Scanning and Analysis
. Aerospace, 1. Source
BibTeX
@article{takehana2025rutting, title = {Rutting Caused by Grouser Wheel of Planetary Rover in Single-Wheel Testbed: {LiDAR} Topographic Scanning and Analysis}, author = {Takehana, Keisuke and Ares, Vinicius Emanoel and Santra, Shreya and Uno, Kentaro and Rohmer, Eric and Yoshida, Kazuya}, journal = {Aerospace}, volume = {12}, number = {1}, pages = {71}, year = {2025}, doi = {10.3390/aerospace12010071}, abstract = {This paper presents datasets and analyses of 3D LiDAR scans capturing the rutting behavior of a rover wheel in a single-wheel terramechanics testbed. The data were acquired using a LiDAR sensor to record the terrain deformation caused by the wheel’s passage through a Toyoura sandbed, which mimics lunar regolith. Vertical loads of 25 N, 40 N, and 65 N were applied to study how rutting patterns change, focusing on rut amplitude, height, and inclination. This study emphasizes the extraction and processing of terrain profiles from noisy point cloud data, using methods like curve fitting and moving averages to capture the ruts’ geometric characteristics. A sine wave model, adjusted for translation, scaling, and inclination, was fitted to describe the wheel-induced wave-like patterns. It was found that the mean height of the terrain increases after the grouser wheel passes over it, forming ruts that slope downward, likely due to the transition from static to dynamic sinkage. Both the rut depth at the end of the wheel’s path and the incline increased with larger loads. These findings contribute to understanding wheel–terrain interactions and provide a reference for validating and calibrating models and simulations. The dataset from this study is made available to the scientific community.} } - Takehana, K., Kizaki, S., Tanaka, T., Uno, K. and Yoshida, K. (2025). Comparison of lunar rover wheel performance in soils with different cohesive properties
. Icarus. Source
BibTeX
@article{takehana2025comparison, title = {Comparison of lunar rover wheel performance in soils with different cohesive properties}, author = {Takehana, Keisuke and Kizaki, Shino and Tanaka, Tomomi and Uno, Kentaro and Yoshida, Kazuya}, journal = {Icarus}, volume = {117}, pages = {101011}, publisher = {Elsevier BV}, year = {2025}, doi = {10.1016/j.jterra.2024.101011} } - Moreland, S., Skonieczny, K., Inotsume, H. and Wettergreen, D. (2012). Soil Behavior of Wheels with Grousers for Planetary Rovers
. IEEE Aerospace Conference. Source
BibTeX
@inproceedings{moreland2012soil, title = {Soil Behavior of Wheels with Grousers for Planetary Rovers}, author = {Moreland, Scott and Skonieczny, Krzysztof and Inotsume, Hiroaki and Wettergreen, David}, booktitle = {IEEE Aerospace Conference}, pages = {1-8}, address = {Big Sky, Montana}, year = {2012}, doi = {10.1109/aero.2012.6187040}, abstract = {The performance of wheels operating in loose granular material for the application of planetary vehicles is well researched but little effort has been made to study the soil shearing which governs traction. Net traction measurements and application of energy metrics have been solely relied upon to investigate performance but lack the ability to evaluate or describe soil-wheel interaction leading to thrust and resistances. The complexity of rim and grouser interaction with the ground has also prevented adequate models from being formulated. This work relies on empirical data gathered in attempt to study the effects of rim surface on soil shearing and ultimately how this governs traction. A novel experimentation and analysis technique was developed to enable investigation of terramechanics fundamentals in great detail. This technique, the Shear Interface Imaging Analysis Tool, is utilized to provide visualization and analysis capability of soil motion at and below the wheel-soil interface. Analysis of the resulting displacement field identifies clusters of soil motion and shear interfaces. Complexities in soil flow patterns greatly affect soil structure below the wheel and the resulting tractive capability. Grouser parameter variations, spacing and height, are studied for a rigid wheel. The results of soil shear interface analysis for wheels with grousers are presented. The processes of thrust and resistances are investigated and behavior characterized for grousered wheels.} } - Daca, A. (2023). Predicting Planetary Rover Mobility in Reduced Gravity Using 1-g Experiments
. Unpublished. Source
BibTeX
@phdthesis{daca2023predicting, title = {Predicting Planetary Rover Mobility in Reduced Gravity Using 1-g Experiments}, author = {Daca, Adriana}, journal = {Unpublished}, school = {Concordia University}, address = {Montreal, Quebec, Canada}, type = {PhD thesis}, month = {February}, year = {2023}, doi = {10.13140/rg.2.2.12718.28485}, abstract = {Traversing granular regolith, especially in reduced gravity environments, remains a potential challenge for wheeled rovers. Mitigating hazards for planetary rovers requires testing in representative environments, but direct Earth-based testing fails to account for the effect of reduced gravity on the soil itself. Here, experimental apparatus and techniques for reduced-gravity flight testing are used to systematically evaluate three existing Earth-based testing methods and develop guidelines for their use and interpretation: (i) reduced-weight testing, (ii) matching soil testing instrument response through soil simulant design, and (iii) granular scaling laws (GSL). \nExperimentation campaigns flying reduced-gravity parabolas, with soil and wheel both in lunar-g, have shown reductions in net traction of 20% or more and increases in sinkage of up to 40% compared to Earth-based testing methods (i) and (ii). Scaled-wheel testing, according to GSL (method iii) has shown better agreement with reduced-g tests (less than 10% error) and also tends to err on the side of conservative predictions. \nLimitations of GSL are investigated including a recently proposed cohesion constraint (that the wheel radius ratio must be the inverse of the gravity ratio) and the effects of wheel size and aspect ratio on GSL’s accuracy. It was found that the cohesion constraint can most likely be ignored for mildly cohesive soils such as lunar regolith. Limits on wheel sizes and aspect ratio variation are also proposed. \nThe application of GSL to planetary rover testing is demonstrated through two studies undertaken in collaboration with NASA’s Jet Propulsion Laboratory. One study compares wheel designs for a skid-steer lunar rover in single-wheel tests scaled by GSL, demonstrating that diagonal grousers improve turning performance without requiring larger wheels. The second study involves application of GSL to the design of two reconfigurable test platforms for evaluating steep-terrain mobility performance. \nAnother aspect of rover mobility testing—normal force control in single-wheel testbeds—is also investigated. An improved method for single-wheel testing, using a 4-bar mechanism, essentially eliminates normal force oscillations from frictional vertical sliders. \nFinally, guidelines for conducting and interpreting 1-g mobility tests for lunar rovers are presented, and potential avenues for future research are outlined.} } - Jiang, M., Dai, Y., Cui, L. and Xi, B. (2018). Experimental and DEM analyses on wheel-soil interaction
. Journal of Terramechanics. Source
BibTeX
@article{jiang2018experimental, title = {Experimental and DEM analyses on wheel-soil interaction}, author = {Jiang, Mingjing and Dai, Yongsheng and Cui, Liang and Xi, Banglu}, journal = {Journal of Terramechanics}, volume = {76}, pages = {15-28}, year = {2018}, doi = {10.1016/j.jterra.2017.12.001} } - Patel, N., Slade, R. and Clemmet, J. (2010). The ExoMars rover locomotion subsystem
. Journal of Terramechanics, 4. Source
BibTeX
@article{patel2010exomars, title = {The ExoMars rover locomotion subsystem}, author = {Patel, Nildeep and Slade, Richard and Clemmet, Jim}, journal = {Journal of Terramechanics}, volume = {47}, number = {4}, pages = {227-242}, publisher = {Elsevier BV}, year = {2010}, doi = {10.1016/j.jterra.2010.02.004} } - Freitag, D. R. (1965). Wheels on soft soils: an analysis of existing data
. U.S. Army Engineer Waterways Experiment Station, Technical Report No. 3-670. Source
BibTeX
@techreport{freitag1965wheels, title = {Wheels on soft soils: an analysis of existing data}, author = {Freitag, Dean R.}, number = {Technical Report No. 3-670}, institution = {U.S. Army Engineer Waterways Experiment Station}, year = {1965}, url = {https://erdc-library.erdc.dren.mil/handle/11681/4716} } - Wong, J. Y. and Reece, A. R. (1967). Prediction of Rigid Wheel Performance Based on the Analysis of Soil-Wheel Stresses
. Journal of Terramechanics, 2. Source
BibTeX
@article{wong1967prediction, title = {Prediction of Rigid Wheel Performance Based on the Analysis of Soil-Wheel Stresses}, author = {Wong, J. Y. and Reece, A. R.}, journal = {Journal of Terramechanics}, volume = {4}, number = {2}, pages = {7--25}, year = {1967}, doi = {10.1016/0022-4898(67)90047-x} } - Green, A. J. and Melzer, K.-J. (1971). Performance of Boeing LRV wheels in a lunar soil simulant. Report 1: Effect of wheel design and soil
. U.S. Army Engineer Waterways Experiment Station, Technical Report M-71-10, Report 1. Source
BibTeX
@techreport{green1971performance, title = {Performance of Boeing LRV wheels in a lunar soil simulant. Report 1: Effect of wheel design and soil}, author = {Green, Andrew J. and Melzer, Klaus-Jurgen}, number = {Technical Report M-71-10, Report 1}, institution = {U.S. Army Engineer Waterways Experiment Station}, year = {1971}, url = {https://erdc-library.erdc.dren.mil/handle/11681/29961} } - Melzer, K.-J. (1971). Performance of the Boeing LRV wheels in a lunar soil simulant. Report 2: Effects of speed, Wheel load, and soil
. U.S. Army Engineer Waterways Experiment Station, NASA-CR-129612. Source
BibTeX
@techreport{melzer1971performance, title = {Performance of the Boeing LRV wheels in a lunar soil simulant. Report 2: Effects of speed, Wheel load, and soil}, author = {Melzer, Klaus-Jurgen}, number = {NASA-CR-129612}, institution = {U.S. Army Engineer Waterways Experiment Station}, year = {1971}, url = {https://ntrs.nasa.gov/citations/19730004536}, abstract = {Two nearly identical Boeing-GM wire-mesh Lunar Roving Vehicle (LRV) wheels were laboratory tested in a lunar soil simulant to determine the influence of wheel speed and acceleration, wheel load, presence of a fender, travel direction, and soil strength on the wheel performance. Constant-slip and three types of programmed-slip tests were conducted with a single-wheel dynamometer system. Test results indicated that performance of single LRV wheels in terms of pull coefficient, power number, and efficiency were not influenced by wheel speed and acceleration, travel direction, the presence of a fender, or wheel load. Of these variables, only load influenced sinkage, which increased with increasing load. For a given slip, the pull coefficient and power number increased with increasing soil strength. However, for a given pull coefficient or slope, slip was less in firmer soil; thus, the power number decreased and efficiency increased with increasing soil strength.} } - Apfelbeck, M., Kuß, S., Wedler, A., Gibbesch, A., Rebele, B. and Schäfer, B. (2009). A Novel Terramechanics Testbed Setup for Planetary Rover Wheel-Soil Interaction
. European Regional Conference of the International Society for Terrain-Vehicle Systems. Source
BibTeX
@inproceedings{apfelbeck2009novel, title = {A Novel Terramechanics Testbed Setup for Planetary Rover Wheel-Soil Interaction}, author = {Apfelbeck, Maximilian and Kuß, Sebastian and Wedler, Armin and Gibbesch, Andreas and Rebele, Bernhard and Schäfer, Bernd}, booktitle = {European Regional Conference of the International Society for Terrain-Vehicle Systems}, address = {Bremen}, year = {2009}, url = {https://elib.dlr.de/62703/} } - Nakashima, H., Fujii, H., Oida, A., Momozu, M., Kanamori, H., Aoki, S., Yokoyama, T., Shimizu, H., Miyasaka, J. and Ohdoi, K. (2010). Discrete Element Method Analysis of Single Wheel Performance for a Small Lunar Rover on Sloped Terrain
. Journal of Terramechanics, 5. Source
BibTeX
@article{nakashima2010discrete, title = {Discrete Element Method Analysis of Single Wheel Performance for a Small Lunar Rover on Sloped Terrain}, author = {Nakashima, H. and Fujii, H. and Oida, A. and Momozu, M. and Kanamori, H. and Aoki, S. and Yokoyama, T. and Shimizu, H. and Miyasaka, J. and Ohdoi, K.}, journal = {Journal of Terramechanics}, volume = {47}, number = {5}, pages = {307--321}, year = {2010}, doi = {10.1016/j.jterra.2010.04.001} } - Oravec, H., Zeng, X. and Asnani, V. (2010). Design and characterization of GRC-1: A soil for lunar terramechanics testing in Earth-ambient conditions
. Journal of Terramechanics, 6. Source
BibTeX
@article{oravec2010design, title = {Design and characterization of GRC-1: A soil for lunar terramechanics testing in Earth-ambient conditions}, author = {Oravec, H.A. and Zeng, X. and Asnani, V.M.}, journal = {Journal of Terramechanics}, volume = {47}, number = {6}, pages = {361--377}, publisher = {Elsevier BV}, year = {2010}, doi = {10.1016/j.jterra.2010.04.006} } - Moreland, S., Skonieczny, K., Wettergreen, D., Creager, C. and Asnani, V. (2011). Soil Motion Analysis System for Examining Wheel-Soil Shearing
. Conference of the International. Source
BibTeX
@inproceedings{moreland2011soil, title = {Soil Motion Analysis System for Examining Wheel-Soil Shearing}, author = {Moreland, Scott and Skonieczny, Krzysztof and Wettergreen, David and Creager, Colin and Asnani, Vivake}, booktitle = {Conference of the International}, address = {Blacksburg, Virginia}, year = {2011}, doi = {10.1184/r1/6560918.v1} } - Brunskill, C., Patel, N., Gouache, T. P., Scott, G. P., Saaj, C. M., Matthews, M. and Cui, L. (2011). Characterisation of Martian Soil Simulants for the ExoMars Rover Testbed
. Journal of Terramechanics, 6. Source
BibTeX
@article{brunskill2011characterisation, title = {Characterisation of {Martian} Soil Simulants for the {ExoMars} Rover Testbed}, author = {Brunskill, Christopher and Patel, Nildeep and Gouache, Thibault P. and Scott, Gregory P. and Saaj, Chakravarthini M. and Matthews, Marcus and Cui, Lei}, journal = {Journal of Terramechanics}, volume = {48}, number = {6}, pages = {419--438}, year = {2011}, doi = {10.1016/j.jterra.2011.10.001} } - Gouache, T. P., Patel, N., Brunskill, C., Scott, G. P., Saaj, C. M., Matthews, M. and Cui, L. (2011). Soil simulant sourcing for the ExoMars rover testbed
. Science, 8. Source
BibTeX
@article{gouache2011soil, title = {Soil simulant sourcing for the ExoMars rover testbed}, author = {Gouache, Thibault P. and Patel, Nildeep and Brunskill, Christopher and Scott, Gregory P. and Saaj, Chakravarthini M. and Matthews, Marcus and Cui, Liang}, journal = {Science}, volume = {59}, number = {8}, pages = {779-787}, publisher = {Elsevier BV}, year = {2011}, doi = {10.1016/j.pss.2011.03.006} } - Skonieczny, K., Moreland, S. J. and Wettergreen, D. S. (2012). A Grouser Spacing Equation for Determining Appropriate Geometry of Planetary Rover Wheels
. IEEE/RSJ International Conference on Intelligent Robots and Systems. Source
BibTeX
@inproceedings{skonieczny2012grouser, title = {A Grouser Spacing Equation for Determining Appropriate Geometry of Planetary Rover Wheels}, author = {Skonieczny, Krzysztof and Moreland, Scott J. and Wettergreen, David S.}, booktitle = {IEEE/RSJ International Conference on Intelligent Robots and Systems}, pages = {5065-5070}, publisher = {IEEE}, year = {2012}, doi = {10.1109/iros.2012.6386203} } - Yang, F., Lin, G. and Zhang, W. (2015). A new dynamic testing system for wheel-soil interactions
. IEEE International Instrumentation and Measurement Technology Conference. Source
BibTeX
@inproceedings{yang2015new, title = {A new dynamic testing system for wheel-soil interactions}, author = {Yang, Fan and Lin, Guoyu and Zhang, Weigong}, booktitle = {IEEE International Instrumentation and Measurement Technology Conference}, pages = {1331-1336}, year = {2015}, doi = {10.1109/i2mtc.2015.7151466}, abstract = {The vehicle trafficability on soft terrain is a key part of the overall vehicle performance. The field investigation and analysis show that lots of research has been done with no general theoretical law. The lack of real vehicle testing data holds back the development of wheel-soil interaction models to a great extent. A new dynamic testing system is presented in this paper to provide a solution for the scarce field testing data. A representative interaction model is introduced to make a brief description of the research problem and indicate the important variables involved. The testing system is based on an integrated real-time acquisition system, which consists of wheel force transducer, GPS, wheel speed sensor, digital camera, cone index penetrometer and watercutmeter. In preliminary field tests, various vehicle maneuvers were executed on rigid road for the validation of the validity, reliability and accuracy of the whole system. Finally, the vehicle equipped with the testing system was tested on kinds of soft terrain. The result shows a good indication of the capacity and potential of the system in the research of the wheel-soil interactions.} } - Karpman, E. (2019). Discrete Element Modelling for Wheel-Soil Interaction and the Analysis of the Effect of Gravity
. Journal of Terramechanics. Source
BibTeX
@article{karpman2019discrete, title = {Discrete Element Modelling for Wheel-Soil Interaction and the Analysis of the Effect of Gravity}, author = {Karpman, Eric}, journal = {Journal of Terramechanics}, volume = {91}, pages = {139-153}, publisher = {Elsevier BV}, school = {McGill University}, address = {Montreal}, year = {2019}, doi = {10.1016/j.jterra.2020.06.002} } - Thoesen, A., McBryan, T., Mick, D., Green, M., Martia, J. and Marvi, H. (2020). Comparative performance of granular scaling laws for lightweight grouser wheels in sand and lunar simulant
. Powder Technology. Source
BibTeX
@article{thoesen2020comparative, title = {Comparative performance of granular scaling laws for lightweight grouser wheels in sand and lunar simulant}, author = {Thoesen, Andrew and McBryan, Teresa and Mick, Darwin and Green, Marko and Martia, Justin and Marvi, Hamid}, journal = {Powder Technology}, volume = {373}, pages = {336-346}, publisher = {Elsevier BV}, year = {2020}, doi = {10.1016/j.powtec.2020.05.114} } - Daca, A., Tremblay, D. and Skonieczny, K. (2021). The Relationship between Cone Penetration Resistance and Wheel-Soil Interactions in Lunar Gravity
. IEEE Aerospace Conference. Source
BibTeX
@inproceedings{daca2021relationship, title = {The Relationship between Cone Penetration Resistance and Wheel-Soil Interactions in Lunar Gravity}, author = {Daca, Adriana and Tremblay, Dominique and Skonieczny, Krzysztof}, booktitle = {IEEE Aerospace Conference}, pages = {1-11}, publisher = {IEEE}, year = {2021}, doi = {10.1109/aero50100.2021.9438503}, abstract = {One of the major challenges faced by planetary exploration rovers today is the negotiation of difficult terrain, such as fine granular regolith commonly found on the Moon and Mars. Typical Earth-based testing methods cannot accurately predict rover mobility in reduced gravity environments (i.e. the Moon and Mars) as they fail to account for the effect of reduced gravity on the soil itself. Preliminary efforts have been made to account for effects of gravity on granular materials, at least indirectly, through simulant design. The soil simulant GRC-1 is designed to produce cone penetrometer readings comparable to those collected on the Moon (i.e. in lunar gravity) during Apollo. The assumption is that replicating the mechanical properties of lunar soil in terms of cone penetration resistance will also replicate the response to vehicle loading in terms of traction. The present research was designed to thoroughly characterize this assumption by exploring the relationship between rover mobility and cone penetration resistance experimentally in lunar gravity (1/6-g) and terrestrial gravity (1-g). The cone penetrometer response of GRC-1 was measured at relative densities (DR'S) of 46%,63%, and 69 % in both 1-g and 1/6-g aboard parabolic flights producing effective lunar gravitational accelerations. Cone index gradient (G) values measured in 1/6-g were 4 x lower on average than those measured in 1-g, indicating a significant decrease in shear strength in lunar-g. Wheel-soil interactions between a smooth rigid wheel and G R C-1 were also characterized at 69% DR in 1/6-g. The wheel experiments measured wheel-soil interaction data at controlled slip values of 20 % and 70 %. Wheel-soil interaction data collected include subsurface soil imaging, force/torque sensor data, wheel sinkage, and motor current, with drawbar pull (DP) and sinkage data reported here. Average DP/W values observed at 20% slip and 70% slip were 0.11 ± 0.02 and 0.32 ± 0.03, respectively, and maximum observed sinkage was 9.0 ± 1.9 mm and 16.2 ± 2.1 mm at 20% and 70 % slip, respectively. These results will be compared to 1-g experiments in a lower-density soil that produces an equivalent cone penetrometer response in order to test the hypothesis that equivalent wheel performance will be observed in soil with equal G values across differing gravity levels.} } - Ishigami, G., Miwa, A., Nagatani, K. and Yoshida, K. (2007). Terramechanics-based model for steering maneuver of planetary exploration rovers on loose soil
. Journal of Field Robotics, 3. Source
BibTeX
@article{ishigami2007terramechanics, title = {Terramechanics-based model for steering maneuver of planetary exploration rovers on loose soil}, author = {Ishigami, Genya and Miwa, Akiko and Nagatani, Keiji and Yoshida, Kazuya}, journal = {Journal of Field Robotics}, volume = {24}, number = {3}, pages = {233-250}, publisher = {Wiley}, year = {2007}, doi = {10.1002/rob.20187}, abstract = {Abstract This paper presents analytical models to investigate the steering maneuvers of planetary exploration rovers on loose soil. The models are based on wheel‐soil interaction mechanics, or terramechanics, with which the traction and disturbance forces of a wheel are evaluated for various slip conditions. These traction forces are decomposed into the longitudinal and lateral directions of the wheel. The latter component, termed the side force has a major influence in characterizing the steering maneuvers of the rover. In this paper, the wheel‐soil mechanics models are developed with particular attention to the side force and the validity of the model is confirmed by using a single‐wheel test bed. The motion profile of the entire rover is numerically evaluated by incorporating the wheel‐soil models into an articulated multibody model that describes the motion dynamics of the vehicle's body and chassis. Steering maneuvers are investigated under different steering angles by using a four‐wheel rover test bed on simulated lunar soil regolith simulant. The experimental results are compared with the simulation results using the corresponding model parameters. The proposed wheel‐and‐vehicle model demonstrates better accuracy in predicting steering maneuvers as compared to the conventional kinematics‐based model. © 2006 Wiley Periodicals, Inc.} } - Toupet, O., Biesiadecki, J., Rankin, A., Steffy, A., Meirion-Griffith, G., Levine, D., Schadegg, M. and Maimone, M. (2020). Traction Control on the Curiosity Mars Rover: Algorithm and Flight Results
. Journal of Field Robotics. Source
BibTeX
@article{toupet2020traction, title = {Traction Control on the Curiosity Mars Rover: Algorithm and Flight Results}, author = {Toupet, Olivier and Biesiadecki, Jeffrey and Rankin, Arturo and Steffy, Amanda and Meirion-Griffith, Gareth and Levine, Dan and Schadegg, Maximilian and Maimone, Mark}, journal = {Journal of Field Robotics}, year = {2020}, doi = {10.48577/jpl.hkzuqs}, abstract = {No abstract available.} } - Sibille, L., Carpenter, P., Schlagheck, R. and French, R. A. (2006). Lunar Regolith Simulant Materials: Recommendations for Standardization, Production, and Usage
. NASA Marshall Space Flight Center, NASA/TP-2006-214605. Source
BibTeX
@techreport{sibille2006development, title = {Lunar Regolith Simulant Materials: Recommendations for Standardization, Production, and Usage}, author = {Sibille, Laurent and Carpenter, Paul and Schlagheck, R. and French, R. A.}, number = {NASA/TP-2006-214605}, institution = {NASA Marshall Space Flight Center}, type = {NASA Technical Publication}, year = {2006}, url = {https://ntrs.nasa.gov/citations/20060051776}, abstract = {Experience gained during the Apollo program demonstrated the need for extensive testing of surface systems in relevant environments, including regolith materials similar to those encountered on the lunar surface. As NASA embarks on a return to the Moon, it is clear that the current lunar sample inventory is not only insufficient to support lunar surface technology and system development, but its scientific value is too great to be consumed by destructive studies. Every effort must be made to utilize standard simulant materials, which will allow developers to reduce the cost, development, and operational risks to surface systems. The Lunar Regolith Simulant Materials Workshop held in Huntsville, AL, on January 24 26, 2005, identified the need for widely accepted standard reference lunar simulant materials to perform research and development of technologies required for lunar operations. The workshop also established a need for a common, traceable, and repeatable process regarding the standardization, characterization, and distribution of lunar simulants. This document presents recommendations for the standardization, production and usage of lunar regolith simulant materials.} } - Meirion-Griffith, G., Nie, C. and Spenko, M. (2013). Development and experimental validation of an improved pressure-sinkage model for small-wheeled vehicles on dilative, deformable terrain
. Journal of Terramechanics. Source
BibTeX
@article{meiriongriffith2013development, title = {Development and experimental validation of an improved pressure-sinkage model for small-wheeled vehicles on dilative, deformable terrain}, author = {Meirion-Griffith, Gareth and Nie, Chenghui and Spenko, Matthew}, journal = {Journal of Terramechanics}, volume = {51}, pages = {19-29}, year = {2013}, doi = {10.1016/j.jterra.2013.11.003} } - Irani, R., Bauer, R. and Warkentin, A. (2011). A dynamic terramechanic model for small lightweight vehicles with rigid wheels and grousers operating in sandy soil
. Acta Astronautica, 4. Source
BibTeX
@article{irani2011dynamic,
  title = {A dynamic terramechanic model for small lightweight vehicles with rigid wheels and grousers operating in sandy soil},
  author = {Irani, R.A. and Bauer, R.J. and Warkentin, A.},
  journal = {Acta Astronautica},
  volume = {48},
  number = {4},
  pages = {307-318},
  publisher = {Elsevier BV},
  year = {2011},
  doi = {10.1016/j.jterra.2011.05.001}
}