Terrain Relative Navigation
Terrain relative navigation (TRN) estimates a vehicle’s position with respect to a map of the body it is approaching, by matching features in descent imagery against that map. It converts an inertial navigation position fix, which for Mars entry can be in error by as much as 3.2 km, into a map-relative fix good enough to steer between hazards that were identified in orbital data before launch [1].
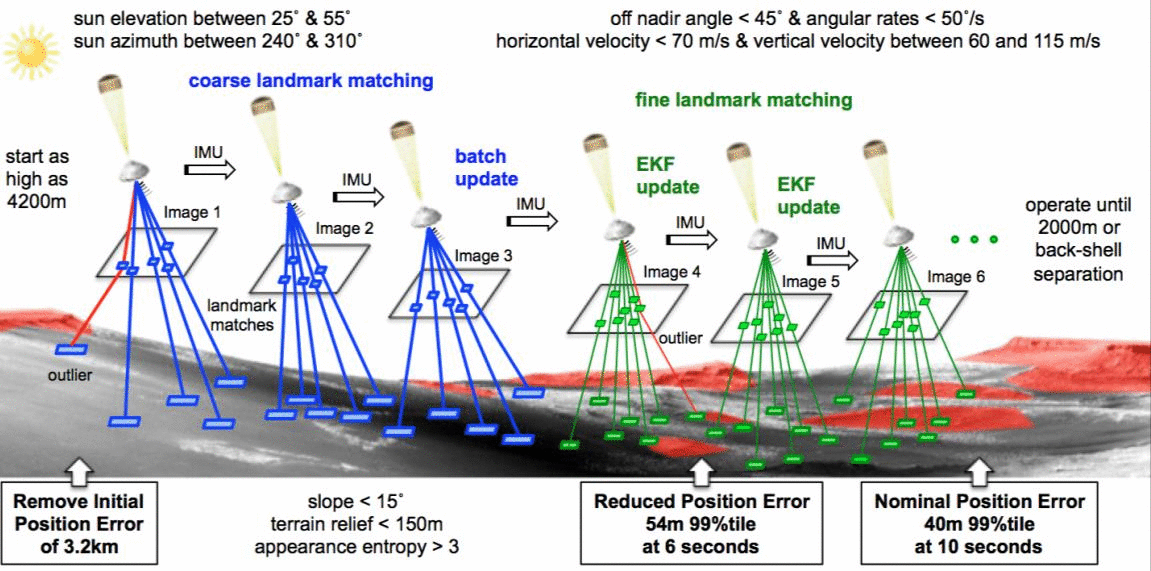
Source: [1]. Public domain (NASA / US government work).
Design space
Section titled “Design space”The technique traces to 1950s cruise missile radar map matching, and took decades of research tasks, field tests and one narrower flown ancestor before Mars 2020 made map relative localization an operational EDL function [9]. Three sensing approaches have flown or been flight-tested, and each trades illumination independence against range and update rate. Camera based matching, flown on Mars 2020 and OSIRIS-REx, needs sunlit terrain that resembles the reference map and is the only approach demonstrated at the multi-kilometer altitudes and tens of meters per second descent rates that Mars entry forces [1][3]. Flash lidar based hazard detection and hazard-relative navigation, flown on the Morpheus rocket lander at Kennedy Space Center in 2014, is illumination independent but pays for it in gimbal scan time, about 6 s to mosaic a 60 x 60 m elevation map from 460 m slant range, and its compute element split a real-time FPGA front end from a manycore Linux processor specifically to keep hard timing off the operating system [10][11]. Radar based localization reuses a terminal descent radar already carried for velocity and altitude: reprocessing the Mars 2020 six-beam terminal descent radar returns through a factor graph smoother gave a usable position estimate at 6.4 km altitude, almost 2 km before the camera based LVS begins, though each scan takes about 10 s to accumulate against the radar’s 20 Hz beam rate [12]. No flown mission has needed to choose between these approaches on one vehicle; each was selected for the illumination and timeline constraints of its own mission.
What it computes
Section titled “What it computes”Input is a sequence of descent images, an onboard map of the landing area, inertial measurement unit data, and an initial state estimate [1][3]. Output is a map-relative position, velocity and attitude, and on Mars 2020 a landing target that the Safe Target Selection function derives from it [7]. The answer must be produced inside the descent timeline, which on Mars 2020 is 10 s [8].
Map Relative Localization, Mars 2020
Section titled “Map Relative Localization, Mars 2020”The Lander Vision System (LVS) reduces an initial 3.2 km horizontal position error to 40 m in 10 s, with a degraded requirement of 54 m at 6 s to cover a late start or a reboot inside the operational window [1]. The requirement is to be met over all possible EDL conditions, which is what the field test campaign was built to demonstrate [8]. Processing is coarse to fine, in four stages [1]. The initial state seeds inertial propagation and crops the onboard map, which is about 12 km on a side, with computational constraints capping any processed map at 1024x1024 pixels. At 4200 m above ground level, coarse matching runs five large patches in each of three descent images against a coarse map at about 12 m/pixel, fused with propagated IMU data to give a horizontal correction [1]. The coarse correction then crops a fine map 6 km on a side at 6 m/pixel, and fine matching runs up to 150 small patches per descent image as measurements into an extended Kalman filter estimating position, velocity, attitude and IMU biases. The 40 m requirement is met after three fine images, and processing continues to 2000 m AGL or until the spacecraft reports backshell separation [1].
The operational envelope the algorithm must hold across is vertical velocity 65 to 115 m/s, horizontal velocity to 70 m/s, attitude rates to 50 deg/s, off-nadir angles to 45 degrees, mean terrain slope to 15 degrees and terrain relief to 150 m standard deviation within a 1500 x 1500 m coarse landmark footprint, sun elevation 25 to 55 degrees and image entropy as low as 3.0, roughly 8 DN of contrast in a 256 DN image [1]. The same envelope drove the field test campaign of May 2019, which flew an engineering model camera and inertial measurement unit on a two-axis gimbal on the front of a helicopter over six test sites in the Mojave National Preserve and Death Valley, chosen for cliffs, lava flows, dune fields, salt flats and bland slopes resembling Jezero Crater, with the Vision Compute Element and its flight software in the cabin and over 600 real-time runs executed [8].
A helicopter can only descend a few meters per second, far short of the 65 to 115 m/s vertical velocity a real Mars entry forces, so the field test could not by itself demonstrate that vertical motion does not corrupt the horizontal position estimate [1][13]. That gap was closed three separate ways: replaying real Mars Science Laboratory descent imagery and descent IMU data against an orbital map, a 250-run Monte Carlo of simulated parachute descent to Northeast Syrtis, and synthetic descents stitched from real field-test images taken up ascending helicopter spirals over Kelso Sand Dunes. All three agreed that vertical velocity does not significantly affect horizontal position estimation [13]. Pre-launch verification also depended on a ray-traced camera simulator, validated after landing by rendering the reconstructed flight trajectory and comparing it against two downlinked LCAM images: the renderer reproduced the opposition effect location and the dust-driven contrast reduction to within a few data numbers, while under-predicting the darkening at the image corners [14].
DIMES, Mars Exploration Rovers
Section titled “DIMES, Mars Exploration Rovers”The first flown ancestor solved a narrower problem: horizontal velocity rather than position. MER’s radar could not measure horizontal velocity relative to the surface, and atmospheric models predicted sustained winds able to impart more horizontal velocity than the airbag landing system was rated for [6]. The Descent Image Motion Estimation System took three images 2.5 s apart from a target altitude of 2000 m, projected them onto the nominal ground plane using radar and attitude measurements, tracked two surface features between each image pair, and differenced the two resulting velocity measurements to check the implied average acceleration against the accelerometers [6]. Its budget was to acquire three images at 3.75 s each and analyze them within 17 s using no more than 40 percent of the 20 MHz CPU, with the whole system flight-qualified in under two years. Design work covered image smear at slew rates to 60 deg/s and correction of radiometric and frame-transfer artifacts [6]. DIMES produced velocity measurements for both rovers; Opportunity’s horizontal velocity was already inside the airbag envelope, while Spirit met higher winds and the DIMES estimate was required to bring horizontal velocity inside the airbag rating by firing the transverse impulse rocket motors seconds before impact.
Natural Feature Tracking, OSIRIS-REx
Section titled “Natural Feature Tracking, OSIRIS-REx”NFT estimates the spacecraft orbital state by matching cataloged surface features. For each expected feature it holds a small digital elevation model and co-registered albedo, renders the expected appearance from the predicted spacecraft position, spacecraft attitude, asteroid attitude and sun vector, and matches that render against the NavCam image by normalized cross correlation [3]. Two metrics qualify each match: the correlation score, and the pixel error between the correlation peak and its predicted location. Matches feed a Kalman filter that updates the trajectory estimate.
The sequence is fixed. Orbit departure occurs about 1 km from Bennu’s center, roughly 4 hours before Checkpoint at 125 m altitude, where NFT updates the burn; Matchpoint follows 10 minutes later at 50 m and sets horizontal velocity to match surface rotation; contact is a free fall at -10 cm/s vertical, followed by a 70 cm/s backaway burn [4]. NFT continues processing images through final descent to predict the time and position of contact.
Cost on flight hardware
Section titled “Cost on flight hardware”| Mars 2020 LVS | OSIRIS-REx NFT | |
|---|---|---|
| Processor | BAE RAD750, build-to-print from MSL, under VxWorks | spacecraft flight computer, not published in the cited work |
| Accelerator | Xilinx Virtex5QV Vision Processor FPGA on the Computer Vision Accelerator Card | none reported |
| Second FPGA | RTAX2000 housekeeping, burn-once, loads the Vision Processor | not applicable |
| Memory | 32 MB rad-hard NOR, 1 GB DDR2 SDRAM, 16 GB NAND | not published in the cited work |
| Camera | LCAM, 1024x1024 global shutter, 90 x 90 deg FOV, about 1 ms exposure, about 100 ms latency, under 1 kg | NavCam |
| Time budget | 40 m in 10 s, 54 m in 6 s | Checkpoint at 125 m, Matchpoint 10 min later at 50 m |
Sources: [1] for the LVS column except where noted, [4] for the NFT sequence.
Hundreds of landmarks cannot be matched in under 10 s on a standard flight processor, which is why the LVS carries a dedicated Vision Compute Element rather than running on the Rover Compute Element [1]. The VCE is three cards in a 6U chassis on a cPCI backplane: a power conditioning unit and a RAD750 board, both build-to-print from MSL, and the new Computer Vision Accelerator Card. As flown, the LVS comprises the VCE, the LCAM, the descent IMUs and the Safe Target Selection function that consumes the position fix [7]. The LVS interfaces to the rover compute elements over 1553 at 8 Hz in both directions, and takes inertial data from the descent stage Descent IMUs over RS-422 through a Y-splitter [1]. Flight software runs on a deterministic timeline in which image exposures and landmark match updates occur at fixed times relative to LVS initialization [1]. The internal rates are about 1 Hz megapixel grayscale images from the LCAM and 8 Hz state packets in each direction over 1553.
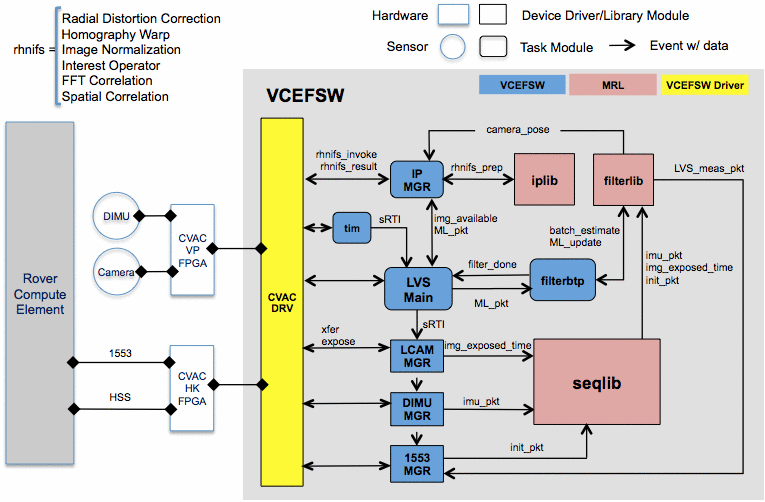
Source: [1]. Public domain (NASA / US government work).
The LCAM had to take crisp images under high attitude rates with a global shutter and low exposure time, deliver them to the VCE with low latency, and hold a field of view wide enough to cover a useful area of the map at up to 45 degrees off nadir, all inside 1 kg on the outside of the rover [1]. Because it operates only during EDL it does not have to survive surface diurnal cycles, which relaxed its thermal qualification.
The as-built LCAM uses an On Semiconductor Python 5000 detector windowed from 2592x2048 to 1024x1024 in 2x2 summed mode, 9.6 micrometer effective pixel pitch, 1.67 mrad pixel scale, f/2.7 at 5.8 mm focal length, 480 to 720 nm, 880 g, 82 x 102 x 154 mm, 480 Mbps LVDS video output [2]. After landing the camera interface FPGA is reconfigured to support surface stereo and visual odometry processing, which is what makes the same box useful for the rest of the mission.
Reuse after landing
Section titled “Reuse after landing”The LVS hardware does not stop working at touchdown. The Vision Compute Element remains powered as a second RAD750 board on the rover, and after landing the camera interface FPGA is reprogrammed for surface stereo correlation and visual odometry [2][5]. That reprogrammed Virtex-5QV is what raises the stereo throughput to 22 million disparities per second and lets Perseverance process 240,000 to 1,200,000 stereo pixels per drive step against 40,000 to 200,000 on Curiosity [5]. A terrain relative navigation sensor bought for 10 s of descent therefore pays for the surface autonomy budget of the whole mission.
Measured performance
Section titled “Measured performance”The LVS error budget was closed at a 17.3 m root sum square current best estimate against a 28.2 m allocation, both at the 99th percentile [1], against the 40 m requirement:
| Error source | Current best estimate (99th percentile) | Allocation |
|---|---|---|
| Algorithm resampling, warping, correlation | 0.6 m | 1 m |
| DIMU accelerometer and gyro noise | 0.4 m | 1 m |
| LCAM image noise and radial distortion | 1.1 m | 5 m |
| LCAM focal length error | 16.9 m | 20 m |
| LCAM to DIMU misalignment | 3.0 m | 15 m |
| Map distortion and rotation | 3.4 m | 12 m |
| Total, root sum square | 17.3 m | 28.2 m |
Source: [1], Table 2, dated 29 September 2016.
The dominant term is calibration, not vision. Focal length is estimated to about 1 percent from images of a dot grid on a flat target board, and a 1 percent error shifts the point where the landmark bearing vectors intersect, which produces up to 17 m of horizontal position error when the camera looks off nadir [1]. The algorithm itself contributes 0.6 m, one tenth of a map pixel, measured on a flat high-contrast synthetic map with all sensor and map errors disabled. In flight the local distortion of the map, the largest predicted error contributor, was measured after landing at about 3 m standard deviation, and about 1.5 m over the region where most landmarks were matched [7]. LCAM to DIMU misalignment of 0.75 deg/axis, which shock, parachute dynamics and thermal drift can produce across the slipping cup and cone interface between rover and descent stage, is absorbed into the attitude estimate and costs no more than 3.0 m of position [1].
Simulation over the North East Syrtis site returned horizontal position error under 14.8 m and vertical error under 45 m after six images, inside the root sum square budget [1]. The map itself was specified to under 150 m horizontal and 20 m vertical position error, under 1 mrad orientation error, local distortion under 6 m below 120 m baselines and 12 m above, and 2 m 1-sigma pixel-to-pixel elevation error; the horizontal map error cancels at system level because the hazard map is co-registered with the LVS map.
Flight results from 18 February 2021, compared against the reconstructed trajectory, give velocity errors under 0.25 m/s and attitude errors under 0.05 degrees in two axes and 0.1 degrees in the third, against a 40 m position estimation requirement [7]. LVS marked its position estimate VALID on the first fine image, which matched 150 landmarks for 92 inliers, and held the highest localization accuracy ranking for all 42 fine images matched down to 500 m, every one of them with 80 or more inliers. Coarse landmark correlation peak heights from EDL agreed with the two helicopter field test runs and with simulation, while the interest operator score was lower than in the field tests because Jezero Crater is dustier and lower in contrast than the terrestrial sites. Total landing error was 5 m from the targeted location against a 60 m requirement [7]. The vehicle landed safely surrounded by hazards, and the paper records terrain relative navigation as planned for the Mars Sample Retrieval Lander if that mission is approved for implementation. TRN diverted Perseverance a few kilometers east of the Jezero delta to avoid hazards, which is what the Rapid Traverse Campaign of March 2022 later had to drive back [5].
The full engineering record of the same flight puts the in-flight LVS position error at about 3 m against the 40 m requirement, and attributes more than 60 percent of the pre-flight 33 m error budget, 20 of 33 m, to reference map error rather than to the algorithm; a set of map corrections against the CTX orbital imagery reduced that map error about sevenfold before launch [9][15]. In flight LVS matched all 15 coarse landmarks, producing a 137 m position correction against a design case of up to 3.2 km, and delivered its first valid fine estimate 5.84 s after coarse processing began [15].
What comes next
Section titled “What comes next”The Mars Sample Retrieval Lander would remove the landing Doppler radar Mars 2020 still carried and make an extension of LVS, the Enhanced Lander Vision System, the sole EDL navigation sensor from the heading-alignment phase of hypersonic entry down to 50 m altitude, targeting a 60 m pinpoint landing [16]. Preliminary design Monte Carlo results close every axis with margin, for example 15.0 m 99th-percentile horizontal position error against a 35 m requirement late in the terrain relative navigation phase, using maps as large as 90 x 90 km at 18 m per pixel for the hypersonic phase [16]. That mission would also land in early Martian morning, outside the sun elevation envelope Mars 2020 flew in, and landmark matching against an afternoon-lit reference map degrades sharply under a morning descent image: fine landmark inliers fall from the roughly 150 seen in an afternoon control to as few as 20 near 6:30 local solar time, below the threshold needed for a position update [17]. Predicting the morning appearance of the reference map from stacks of afternoon orbital images recovers most of the loss, raising dense correlation on the hardest tested image from 34 percent to as much as 82 percent, still under active development rather than flight-qualified [17].
For OSIRIS-REx the driving number was the mismatch between capability and terrain. The Flight Dynamics System requirement was delivery to a site of 25 m radius, and no hazard-free site on Bennu proved larger than 8 m in radius [4]. NFT replaced lidar as the prime guidance update because lidar gives accurate range but not cross-track position, and because the lidar automatic gain controller carried a concern. Improved modeling reduced the pre-launch 3-sigma TAG position dispersion of 17 to 20 m to between 5.66 and 8.12 m across the four candidate sites, with horizontal velocity dispersion from 12 to 15 mm/s down to 4.56 to 6.64 mm/s against a 20 mm/s requirement [4]:
| Site | TAG position dispersion (3 sigma) | Horizontal velocity (3 sigma) | Vertical velocity (3 sigma) |
|---|---|---|---|
| Pre-launch model | 17 to 20 m | 12 to 15 mm/s | 9.4 to 15 mm/s |
| Nightingale | 8.12 m | 6.64 mm/s | 6.95 mm/s |
| Kingfisher | 5.89 m | 5.03 mm/s | 7.54 mm/s |
| Osprey | 5.66 m | 4.56 mm/s | 6.39 mm/s |
| Sandpiper | 7.29 m | 6.47 mm/s | 5.57 mm/s |
Source: [4], Table 6.
NFT state uncertainty at Checkpoint improved from a pre-launch 3.0 m and 3.0 mm/s per axis, 3 sigma, to 2.1 m and 2.9 mm/s in flight, and the uncertainty in the final onboard TAG position estimate was taken as 1.27 m at 3 sigma for site selection [4].
Other platforms and families
Section titled “Other platforms and families”A pre-Mars 2020 survey of ten lunar landing approaches split them by passive imaging versus active ranging and by whether they yield global position, local position or velocity [18]. Its simulation rule is that about 20 by 20 map pixels are needed for a reliable fix, so a 10 m elevation map supports range image correlation from a 200 x 200 m scan, and range image to map correlation reaches a 95 percent circular error probable of about half the map resolution. That result is a best-case bound from synthetic terrain with the lidar retuned at every altitude, and the survey notes that pre-LRO global lunar maps at 7.6 km per pixel were unusable for the purpose [18].
The prototype of the Mars 2020 system, a LEON3 and FPGA compute element with a commercial camera, was flown on a helicopter in 2014 [19]. Across 429 runs, 128 of them inside the Mars 2020 envelope, it brought a plus or minus 3 km initial error inside the 40 m requirement in 10 s, and a threshold of 200 landmark matches separated good estimates from the 7 bad ones. The helicopter reached about 5 m/s vertical rate against 80 to 105 m/s for the application, and a position bias of roughly 10 m was left unexplained [19]. The Mars 2020 landing error budget was tracked through three revisions: about 45 m pre-launch, 33.05 m after an in-flight attitude calibration, and 8.53 m in the post-landing reconstruction against an imagery-measured 5 m. The last figure is a re-run of the budget with landing-day inputs, not an independent measurement, and the descent fell near the center of the envelope [20].
Other bodies change the map problem rather than the matching. For Titan, Cassini map products at 300 m to 3 km per pixel [21] and haze that removes image contrast with altitude limit map matching to roughly 40 to 20 km altitude, with 3-sigma errors of about 1.5 km over the lake district; feature tracking takes over below that [21]. The study is entirely simulated, and its parafoil carrier does not exist [21]. On the Moon, JAXA’s SLIM matched craters against an onboard map and detected obstacles at 50 m altitude, and landed on 19 to 20 January 2024. This is the one flown crater-matching system in the cited set, from a single flight, and the landing was about 60 m east of the original target after a thruster anomaly [22].
Surface rovers have a related need, a global fix without a landing-time map match. LunarNav matches craters detected by lidar or stereo against an orbital crater catalog with a particle filter and a Gaussian-mixture matcher, reaching near 0.75 to 2 m error in simulated traverses, but its stereo detector did not generalize to real Chang’e 4 imagery, so no end-to-end result on real surface data exists [23]. A geometric bound on bearing-only fixes to orbit-catalogd peaks in Jezero found 54 landmarks and dilution of precision of about 10 m in favorable regions, above 100 m elsewhere, and unbounded in the riverbed; it is a lower bound, not an implementation [24].
Failure modes
Section titled “Failure modes”Illumination mismatch between map and descent image is the standing risk in both systems. The LVS operational envelope admits sun elevations from 25 to 55 degrees and azimuths from 240 to 310 degrees clockwise from north, and these variations introduce appearance differences that landmark matching has to absorb [1]. NFT renders each feature under the predicted sun angle precisely to remove that term, which transfers the problem to the accuracy of the shape model [3].
Shape model quality bounded NFT feature availability. Requirements originally written for global and TAG-site accuracy proved insufficient for building features, so a separate set of correlation pixel error and correlation score thresholds had to be defined per feature [3]. Laser altimeter derived digital terrain models met the correlation pixel error requirement for larger rocks and craters, but for smaller features near the sample site the 3 cm per-measurement error masked the elevation signal, and a large majority of features would not have been adequate under the original requirements. Stereophotoclinometry models carry albedo, which helps where shadows are absent, but the least-squares solution can smooth out feature shape and so remove the shadows that make a feature correlate.
Low terrain contrast is the LVS analogue: bland regions with image entropy as low as 3.0 are inside the required envelope and must still produce matches [1]. The MER precedent for a descent vision system failing gracefully was DIMES, which was required to know when its own measurement was unreliable rather than only to produce one [6].
LVS itself is verified against that risk by a combination of venues rather than by analysis alone: simulation, hardware-in-the-loop system testing and field testing, with the captive carry helicopter field test treated as the most trusted result and used to certify the simulation venue [8].
Neither system has a second chance. The LVS answer is consumed just before backshell separation to compute a landing target that avoids both hazards and the backshell [1]. OSIRIS-REx handles the equivalent case by declaring failure: a flight software patch compares the NFT-predicted TAG position and its uncertainty against an onboard hazard map, computes the probability of unsafe contact and triggers the backaway burn early if that probability exceeds a threshold, which changes the design metric from delivery ellipse size to probability of success [4].
What is not established
Section titled “What is not established”Mars 2020 gives one flight in benign illumination, with an unusually small initial position error, so it exercises a small part of the declared operational envelope; the field test that stands in for the rest never covered vertical velocity directly; and it found LVS failing its position requirement under illumination differences and terrain relief outside the declared envelope but plausible elsewhere [1][9]. The 5 m and 3 m flight accuracy figures are system level results, anchored to a reconstructed trajectory that is itself tied to the landing site, not independent measurements of the vision algorithm alone [7][9]. The lidar-based approach has flown fewer times and less successfully: on Morpheus, hazard detection met its requirements on every flight but the paired hazard-relative navigation measurement succeeded on only a handful of attempts out of many, because the tracked feature drifted once its own measurements closed the loop into the vehicle’s navigation filter [10]. The radar-based reprocessing result and the Enhanced Lander Vision System design for early-morning Mars landing are both pre-flight: one a post-hoc replay of Mars 2020 telemetry through an algorithm never run onboard, the other a preliminary design closed entirely in simulation against rendered and predicted imagery [12][16][17]. No source held here reports processor utilization, memory footprint or power for any of these systems in flight, so the computational margin actually available during descent is not established from what is cited.
References
- Johnson, A., Aaron, S., Chang, J., Cheng, Y., Montgomery, J., Mohan, S., Schroeder, S., Tweddle, B., Trawny, N. and Zheng, J. (2017). The Lander Vision System for Mars 2020 Entry Descent and Landing
. Annual AAS Guidance, Navigation and Control Conference. Source
BibTeX
@inproceedings{johnson2017lander, title = {The Lander Vision System for Mars 2020 Entry Descent and Landing}, author = {Johnson, Andrew and Aaron, Seth and Chang, Johnny and Cheng, Yang and Montgomery, James and Mohan, Swati and Schroeder, Steven and Tweddle, Brent and Trawny, Nikolas and Zheng, Jason}, booktitle = {Annual AAS Guidance, Navigation and Control Conference}, address = {Breckenridge, Colorado}, year = {2017}, url = {https://dataverse.jpl.nasa.gov/dataset.xhtml?persistentId=hdl:2014/46186} } - Maki, J. N., Gruel, D., McKinney, C., Ravine, M. A., Morales, M., Lee, D., Willson, R., Copley-Woods, D., Valvo, M., Goodsall, T., McGuire, J., Sellar, R. G., Schaffner, J. A., Caplinger, M. A., Shamah, J. M., Johnson, A. E., Ansari, H., Singh, K., Litwin, T., Deen, R., Culver, A., Ruoff, N., Petrizzo, D., Kessler, D., Basset, C., Estlin, T., Alibay, F., Nelessen, A. and Algermissen, S. (2020). The Mars 2020 Engineering Cameras and Microphone on the Perseverance Rover: A Next-Generation Imaging System for Mars Exploration
. Space Science Reviews, 137. Source
BibTeX
@article{maki2020mars, title = {The Mars 2020 Engineering Cameras and Microphone on the Perseverance Rover: A Next-Generation Imaging System for Mars Exploration}, author = {Maki, Justin N. and Gruel, D. and McKinney, C. and Ravine, Michael A. and Morales, M. and Lee, D. and Willson, R. and Copley-Woods, D. and Valvo, M. and Goodsall, T. and McGuire, Jill and Sellar, R. G. and Schaffner, Jacob A. and Caplinger, Michael A. and Shamah, Joe M. and Johnson, A. E. and Ansari, H. and Singh, Kaustabh and Litwin, T. and Deen, R. and Culver, A. and Ruoff, N. and Petrizzo, D. and Kessler, D. and Basset, C. and Estlin, T. and Alibay, Farah and Nelessen, Adam and Algermissen, Stirling}, journal = {Space Science Reviews}, volume = {216}, number = {137}, pages = {137--137}, year = {2020}, doi = {10.1007/s11214-020-00765-9}, abstract = {Abstract The Mars 2020 Perseverance rover is equipped with a next-generation engineering camera imaging system that represents an upgrade over previous Mars rover missions. These upgrades will improve the operational capabilities of the rover with an emphasis on drive planning, robotic arm operation, instrument operations, sample caching activities, and documentation of key events during entry, descent, and landing (EDL). There are a total of 16 cameras in the Perseverance engineering imaging system, including 9 cameras for surface operations and 7 cameras for EDL documentation. There are 3 types of cameras designed for surface operations: Navigation cameras (Navcams, quantity 2), Hazard Avoidance Cameras (Hazcams, quantity 6), and Cachecam (quantity 1). The Navcams will acquire color stereo images of the surface with a $96^{\circ}\times 73^{\circ}$ 96 ∘ × 73 ∘ field of view at 0.33 mrad/pixel. The Hazcams will acquire color stereo images of the surface with a $136^{\circ}\times 102^{\circ}$ 136 ∘ × 102 ∘ at 0.46 mrad/pixel. The Cachecam, a new camera type, will acquire images of Martian material inside the sample tubes during caching operations at a spatial scale of 12.5 microns/pixel. There are 5 types of EDL documentation cameras: The Parachute Uplook Cameras (PUCs, quantity 3), the Descent stage Downlook Camera (DDC, quantity 1), the Rover Uplook Camera (RUC, quantity 1), the Rover Descent Camera (RDC, quantity 1), and the Lander Vision System (LVS) Camera (LCAM, quantity 1). The PUCs are mounted on the parachute support structure and will acquire video of the parachute deployment event as part of a system to characterize parachute performance. The DDC is attached to the descent stage and pointed downward, it will characterize vehicle dynamics by capturing video of the rover as it descends from the skycrane. The rover-mounted RUC, attached to the rover and looking upward, will capture similar video of the skycrane from the vantage point of the rover and will also acquire video of the descent stage flyaway event. The RDC, attached to the rover and looking downward, will document plume dynamics by imaging the Martian surface before, during, and after rover touchdown. The LCAM, mounted to the bottom of the rover chassis and pointed downward, will acquire $90^{\circ}\times 90^{\circ}$ 90 ∘ × 90 ∘ FOV images during the parachute descent phase of EDL as input to an onboard map localization by the Lander Vision System (LVS). The rover also carries a microphone, mounted externally on the rover chassis, to capture acoustic signatures during and after EDL. The Perseverance rover launched from Earth on July 30th, 2020, and touchdown on Mars is scheduled for February 18th, 2021.} } - Lorenz, D. A., Olds, R., May, A., Mario, C., Perry, M. E., Palmer, E. E. and Daly, M. (2017). Lessons Learned from OSIRIS-REx Autonomous Navigation Using Natural Feature Tracking
. IEEE Aerospace Conference. Source
BibTeX
@inproceedings{lorenz2017lessons, title = {Lessons Learned from OSIRIS-REx Autonomous Navigation Using Natural Feature Tracking}, author = {Lorenz, David A. and Olds, Ryan and May, Alexander and Mario, Courtney and Perry, Mark E. and Palmer, Eric E. and Daly, Michael}, booktitle = {IEEE Aerospace Conference}, pages = {1-12}, address = {Big Sky, Montana}, year = {2017}, doi = {10.1109/aero.2017.7943684}, abstract = {The Origins, Spectral Interpretation, Resource Identification, Security-Regolith Explorer (Osiris-REx) spacecraft is scheduled to launch in September, 2016 to embark on an asteroid sample return mission. It is expected to rendezvous with the asteroid, Bennu, navigate to the surface, collect a sample (July 20), and return the sample to Earth (September 23). The original mission design called for using one of two Flash Lidar units to provide autonomous navigation to the surface. Following Preliminary design and initial development of the Lidars, reliability issues with the hardware and test program prompted the project to begin development of an alternative navigation technique to be used as a backup to the Lidar. At the critical design review, Natural Feature Tracking (NFT) was added to the mission. NFT is an onboard optical navigation system that compares observed images to a set of asteroid terrain models which are rendered in real-time from a catalog stored in memory on the flight computer. Onboard knowledge of the spacecraft state is then updated by a Kalman filter using the measured residuals between the rendered reference images and the actual observed images. The asteroid terrain models used by NFT are built from a shape model generated from observations collected during earlier phases of the mission and include both terrain shape and albedo information about the asteroid surface. As a result, the success of NFT is highly dependent on selecting a set of topographic features that can be both identified during descent as well as reliably rendered using the shape model data available. During development, the OSIRIS-REx team faced significant challenges in developing a process conducive to robust operation. This was especially true for terrain models to be used as the spacecraft gets close to the asteroid and higher fidelity models are required for reliable image correlation. This paper will present some of the challenges and lessons learned from the development of the NFT system which includes not just the flight hardware and software but the development of the terrain models used to generate the onboard rendered images.} } - Berry, K., Getzandanner, K., Moreau, M., Antreasian, P., Polit, A., Nolan, M., Enos, H. and Lauretta, D. (2020). Revisiting OSIRIS-REx Touch-And-Go (TAG) Performance Given the Realities of Asteroid Bennu
. Annual AAS Guidance, Navigation and Control Conference, AAS 20-088. Source
BibTeX
@inproceedings{berry2020revisiting, title = {Revisiting OSIRIS-REx Touch-And-Go (TAG) Performance Given the Realities of Asteroid Bennu}, author = {Berry, Kevin and Getzandanner, Kenneth and Moreau, Michael and Antreasian, Peter and Polit, Alexander and Nolan, Michael and Enos, Heather and Lauretta, Dante}, booktitle = {Annual AAS Guidance, Navigation and Control Conference}, number = {AAS 20-088}, year = {2020}, url = {https://ntrs.nasa.gov/citations/20200000774}, abstract = {The Origins, Spectral Interpretation, Resource Identification, and Security–Regolith Explorer (OSIRIS-REx) mission is a NASA New Frontiers mission that launched in 2016 and rendezvoused with the near-Earth asteroid (101955) Bennu in late 2018. Upon arrival, the surface of Bennu was found to be much rockier than expected. The original Touch-and-Go (TAG) requirement for sample collection was to deliver the spacecraft to a site with a 25-meter radius; however, the largest hazard-free sites are no larger than 8 meters in radius. To accommodate the dearth of safe sample collection sites, the project reevaluated all aspects of flight system performance pertaining to TAG in order to account for the demonstrated performance of the spacecraft and navigation prediction accuracies. More-over, the project has base lined on board natural feature tracking instead of lidar for providing the on board navigation state update during the TAG sequence. This paper summarizes the improvements in error source estimation, enhancements in on board trajectory correction, and results of recent Monte Carlo simulation to en-able sample collection with the given constraints. TAG delivery and on board navigation performance are presented for the final four candidate TAG sites. } } - Rankin, A., Del Sesto, T., Hwang, P., Justice, H., Maimone, M., Verma, V. and Graser, E. (2023). Perseverance Rapid Traverse Campaign
. IEEE Aerospace Conference. Source
BibTeX
@inproceedings{rankin2023perseverance, title = {Perseverance Rapid Traverse Campaign}, author = {Rankin, Arturo and Del Sesto, Tyler and Hwang, Pauline and Justice, Heather and Maimone, Mark and Verma, Vandi and Graser, Evan}, booktitle = {IEEE Aerospace Conference}, pages = {1-16}, address = {Big Sky, Montana}, year = {2023}, doi = {10.1109/aero55745.2023.10115835}, abstract = {Over the first 13 months of the Mars 2020 mission, the Perseverance rover traversed nearly 5 km along the Jezero Crater floor. Near the end of that period, the Science team was anxious to relocate to the ancient Delta region near the crater rim, over 5 km away. A Rapid Traverse Campaign was planned that would prioritize use of Perseverance's autonomous navigation software to drive at an unprecedented high pace and minimize science activities. The Rapid Traverse Campaign started in March 2022 and lasted 31 Martian days. During the campaign, Perseverance drove over 5 km in 24 drives, during which its autonomy software planned 94.8% of its overall driving, enabling it to set several new planetary rover driving records. Perseverance exceeded the longest daily drive distance record achieved by a previous planetary rover (219 meters) 11 times and set new records for the longest multi-sol drive distance in a single plan (528.7 meters) and the longest continuation drive (699.9 meters) by operating without human drive path input during 3 sols of driving. This paper details the planning and execution of the Rapid Traverse Campaign.} } - Maimone, M. W., Leger, P. C. and Biesiadecki, J. J. (2007). Overview of the Mars Exploration Rovers' Autonomous Mobility and Vision Capabilities
. IEEE International Conference on Robotics and Automation, Space Robotics Workshop. Source
BibTeX
@inproceedings{maimone2007overview, title = {Overview of the Mars Exploration Rovers' Autonomous Mobility and Vision Capabilities}, author = {Maimone, Mark W. and Leger, P. Chris and Biesiadecki, Jeffrey J.}, booktitle = {IEEE International Conference on Robotics and Automation, Space Robotics Workshop}, address = {Rome, Italy}, year = {2007}, url = {https://www-robotics.jpl.nasa.gov/media/documents/mer_autonomy_icra_2007.pdf} } - Johnson, A. E., Aaron, S., Ansari, H., Bergh, C., Bourdu, H., Butler, J., Chang, J., Cheng, R., Cheng, Y., Clark, K., Clouse, D., Donnelly, R., Gostelow, K., Jay, W., Jordan, M., Mohan, S., Montgomery, J. F., Morrison, J., Schroeder, S., Shenker, B., Sun, G., Trawny, N., Umsted, C., Vaughan, G., Ravine, M., Schaffner, J., Shamah, J. M. and Zheng, J. (2022). Mars 2020 Lander Vision System Flight Performance
. AIAA SCITECH Forum. Source
BibTeX
@inproceedings{johnson2022mars, title = {Mars 2020 Lander Vision System Flight Performance}, author = {Johnson, Andrew E. and Aaron, Seth and Ansari, Hugh and Bergh, Charles and Bourdu, Helene and Butler, Jim and Chang, Johnny and Cheng, Richard and Cheng, Yang and Clark, Ken and Clouse, Daniel and Donnelly, Robert and Gostelow, Kim and Jay, William and Jordan, Michael and Mohan, Swati and Montgomery, James F. and Morrison, Jack and Schroeder, Steven and Shenker, Boris and Sun, George and Trawny, Nikolas and Umsted, Carson and Vaughan, Geoffrey and Ravine, Michael and Schaffner, Jacob and Shamah, Joe M. and Zheng, Jason}, booktitle = {AIAA SCITECH Forum}, year = {2022}, doi = {10.2514/6.2022-1214}, abstract = {View Video Presentation: https://doi.org/10.2514/6.2022-1214.vid The Mars 2020 Entry Descent and Landing (EDL) system delivered the Perseverance rover to the surface of Mars on February 18th, 2021. A large fraction of the Jezero Crater landing site was covered with landing hazards including cliffs, inescapable dune fields and rocks. These hazards were identified or inferred using orbital imagery before launch so that they could be avoided using Terrain Relative Navigation (TRN) which was composed of two parts: the Lander Vision System (LVS) and Safe Target Selection (STS). During EDL, the LVS successfully estimated map relative position by fusing landmarks matched between descent imagery and a map of the landing site with Inertial Measurement Unit (IMU) data. This position estimate was used by STS to identify the safest target for landing that was also reachable given fuel and other constraints. The EDL system then used the powered descent phase to retarget to this location and land safely. The overall error between the targeted location and actual landing location was 5m which was an order of magnitude less than the 60m touchdown error requirement. This paper will describe the final tests of the LVS before launch, the checkout of the LVS during operations and the LVS performance during EDL.} } - Johnson, A., Villaume, N., Umsted, C., Kourchians, A., Sternberg, D., Trawny, N., Cheng, Y., Geipel, E. and Montgomery, J. (2020). The Mars 2020 Lander Vision System Field Test
. Annual AAS Guidance, Navigation and Control Conference. Source
BibTeX
@inproceedings{johnson2020bmars, title = {The Mars 2020 Lander Vision System Field Test}, author = {Johnson, A. and Villaume, N. and Umsted, Carson and Kourchians, Ara and Sternberg, D. and Trawny, Nikolas and Cheng, Y. and Geipel, E. and Montgomery, J.}, booktitle = {Annual AAS Guidance, Navigation and Control Conference}, address = {Breckenridge, Colorado}, year = {2020}, url = {https://dataverse.jpl.nasa.gov/dataset.xhtml?persistentId=hdl:2014/47468} } - Johnson, A. E., Trawny, N., Cheng, Y., Ansar, A. I., Montgomery, J. F., Matthies, L. H. and Thurman, S. W. (2023). Development of Terrain-Relative Guidance for Planetary Landing Applications
. Annual AAS Guidance, Navigation and Control Conference. Source
BibTeX
@inproceedings{johnson2023development, title = {Development of Terrain-Relative Guidance for Planetary Landing Applications}, author = {Johnson, Andrew E. and Trawny, Nikolas and Cheng, Yang and Ansar, Adnan I. and Montgomery, James F. and Matthies, Larry H. and Thurman, Sam W.}, booktitle = {Annual AAS Guidance, Navigation and Control Conference}, publisher = {JPL Open Repository}, year = {2023}, doi = {10.48577/jpl.i1uewa}, abstract = {The use of terrain sensing for navigation and guidance in planetary soft landing is a powerful capability for robotic space missions but one that took decades to mature across many different research tasks, technology developments, and field/flight test activities. This paper summarizes significant milestones in the development of this important capability for planetary exploration, which was first employed operationally in NASA’s Mars 2020 mission, as well as related applications that are just maturing and coming into use. A brief look at current work leading to future applications is included.} } - Trawny, N., Huertas, A., Luna, M. E., Villalpando, C. Y., Martin, K. E., Carson, J. M., Johnson, A. E., Restrepo, C. and Roback, V. E. (2015). Flight testing a real-time Hazard Detection System for safe lunar landing on the rocket-powered Morpheus vehicle
. AIAA Guidance, Navigation, and Control Conference. Source
BibTeX
@inproceedings{trawny2015flight, title = {Flight testing a real-time Hazard Detection System for safe lunar landing on the rocket-powered Morpheus vehicle}, author = {Trawny, Nikolas and Huertas, Andres and Luna, Michael E. and Villalpando, Carlos Y. and Martin, Keith E. and Carson, John M. and Johnson, Andrew E. and Restrepo, Carolina and Roback, Vincent E.}, booktitle = {AIAA Guidance, Navigation, and Control Conference}, publisher = {American Institute of Aeronautics and Astronautics}, year = {2015}, doi = {10.2514/6.2015-0326}, abstract = {The Hazard Detection System (HDS) is a component of the ALHAT (Autonomous Landing and Hazard Avoidance Technology) sensor suite, which together provide a lander Guidance, Navigation and Control (GN&C) system with the relevant measurements necessary to enable safe precision landing under any lighting conditions. The HDS consists of a stand-alone compute element (CE), an Inertial Measurement Unit (IMU), and a gimbaled flash LIDAR sensor that are used, in real-time, to generate a Digital Elevation Map (DEM) of the landing terrain, detect candidate safe landing sites for the vehicle through Hazard Detection (HD), and generate hazard-relative navigation (HRN) measurements used for safe precision landing. Following an extensive ground and helicopter test campaign, ALHAT was integrated onto the Morpheus rocket-powered terrestrial test vehicle in March 2014. Morpheus and ALHAT then performed five successful free flights at the simulated lunar hazard field constructed at the Shuttle Landing Facility (SLF) at Kennedy Space Center, for the first time testing the full system on a lunar-like approach geometry in a relevant dynamic environment. During these flights, the HDS successfully generated DEMs, correctly identified safe landing sites and provided HRN measurements to the vehicle, marking the first autonomous landing of a NASA rocket-powered vehicle in hazardous terrain. This paper provides a brief overview of the HDS architecture and describes its in-flight performance.} } - Villalpando, C. Y., Werner, R. A., Carson III, J. M., Khanoyan, G., Stern, R. A. and Trawny, N. (2013). A hybrid FPGA/Tilera compute element for autonomous hazard detection and navigation
. IEEE Aerospace Conference. Source
BibTeX
@inproceedings{villalpando2013hybrid, title = {A hybrid FPGA/Tilera compute element for autonomous hazard detection and navigation}, author = {Villalpando, Carlos Y. and Werner, Robert A. and Carson III, John M. and Khanoyan, Garen and Stern, Ryan A. and Trawny, Nikolas}, booktitle = {IEEE Aerospace Conference}, pages = {1--9}, publisher = {IEEE}, year = {2013}, doi = {10.1109/aero.2013.6496977}, abstract = {To increase safety for future missions landing on other planetary or lunar bodies, the Autonomous Landing and Hazard Avoidance Technology (ALHAT) program is developing an integrated sensor for autonomous surface analysis and hazard determination. The ALHAT Hazard Detection System (HDS) consists of a Flash LIDAR for measuring the topography of the landing site, a gimbal to scan across the terrain, and an Inertial Measurement Unit (IMU), along with terrain analysis algorithms to identify the landing site and the local hazards. An FPGA and Manycore processor system was developed to interface all the devices in the HDS, to provide high-resolution timing to accurately measure system state, and to run the surface analysis algorithms quickly and efficiently. In this paper, we will describe how we integrated COTS components such as an FPGA evaluation board, a TILExpress64, and multi-threaded/multi-core aware software to build the HDS Compute Element (HDSCE). The ALHAT program is also working with the NASA Morpheus Project and has integrated the HDS as a sensor on the Morpheus Lander. This paper will also describe how the HDS is integrated with the Morpheus lander and the results of the initial test flights with the HDS installed. We will also describe future improvements to the HDSCE.} } - Setterfield, T. P., Hewitt, R. A., Chen, P.-T., Marcus, C. L. and Trawny, N. (2022). Real-World Testing of LiDAR-Inertial Based Navigation and Mapping for Precision Landing
. IEEE Aerospace Conference. Source
BibTeX
@inproceedings{setterfield2022real, title = {Real-World Testing of LiDAR-Inertial Based Navigation and Mapping for Precision Landing}, author = {Setterfield, Timothy P and Hewitt, Robert A. and Chen, Po-Ting and Marcus, Corey L. and Trawny, Nikolas}, booktitle = {IEEE Aerospace Conference}, pages = {1-10}, publisher = {IEEE}, year = {2022}, doi = {10.1109/aero53065.2022.9843356}, abstract = {The fusion of LiDAR and inertial measurements during spacecraft descent and landing can be used to estimate a lander's navigation state and map the terrain below. Together, these data products can be used to enable safe and precise landing on celestial bodies for which a priori orbital reconnaissance is insufficient for hazard detection and avoidance. Unlike camera images used in visual terrain relative navigation, LiDAR scans are insensitive to changes in illumination; as a result, the technique can be used to land in poorly lit areas, or at times of day when the lighting conditions are incongruent with existing orbital imagery. In this paper, we extend previous work in which we introduced a factor graph based smoothing approach for LiDAR-inertial navigation and mapping. Whereas the algorithms were previously tested on simulated data, this paper presents testing on real-world data. Data from the Autonomous Landing Hazard Avoidance Technology (ALHAT) airplane flight tests in the Yucca Flats and Death Valley in 2009 (FT3), the Morpheus vertical take off and landing flight tests at Kennedy Space Center in 2014 (FT6), and the landing of Perseverance and Ingenuity on Mars in 2021 (M2020) were used to evaluate algorithm performance. In this paper, we extend our LiDAR-inertial technique to work with a variety of ranging technologies: single point laser altimetry (FT3), dense flash LiDAR (FT6), and six-beam radar (M2020). A thorough performance analysis for all three datasets is presented. Dataset preparation, improvements in algorithm robustness, and outlier rejection, which were necessitated by the transition to real-world data, are discussed.} } - Johnson, A. E., Aaron, S., Cheng, Y., Montgomery, J., Trawny, N., Tweddle, B., Vaughan, G. and Zheng, J. (2016). Design and Analysis of Map Relative Localization for Access to Hazardous Landing Sites on Mars
. AIAA Guidance, Navigation, and Control Conference. Source
BibTeX
@inproceedings{johnson2016design, title = {Design and Analysis of Map Relative Localization for Access to Hazardous Landing Sites on Mars}, author = {Johnson, Andrew E. and Aaron, Seth and Cheng, Yang and Montgomery, James and Trawny, Nikolas and Tweddle, Brent and Vaughan, Geoffrey and Zheng, Jason}, booktitle = {AIAA Guidance, Navigation, and Control Conference}, publisher = {American Institute of Aeronautics and Astronautics}, address = {San Diego, California}, year = {2016}, doi = {10.2514/6.2016-0379}, abstract = {Human and robotic planetary lander missions require accurate surface relative position knowledge to land near science targets or next to pre-deployed assets. In the absence of GPS, accurate position estimates can be obtained by automatically matching sensor data collected during descent to an on-board map. The Lander Vision System (LVS) that is being developed for Mars landing applications generates landmark matches in descent imagery and combines these with inertial data to estimate vehicle position, velocity and attitude. This paper describes recent LVS design work focused on making the map relative localization algorithms robust to challenging environmental conditions like bland terrain, appearance differences between the map and image and initial input state errors. Improved results are shown using data from a recent LVS field test campaign. This paper also fills a gap in analysis to date by assessing the performance of the LVS with data sets containing significant vertical motion including a complete data set from the Mars Science Laboratory mission, a Mars landing simulation, and field test data taken over multiple altitudes above the same scene. Accurate and robust performance is achieved for all data sets indicating that vertical motion does not play a significant role in position estimation performance.} } - Aaron, S., Cheng, Y., Trawny, N., Mohan, S., Montgomery, J., Ansari, H., Smith, K., Johnson, A., Goguen, J. and Zheng, J. (2022). Camera Simulation for the Perseverance Rover's Lander Vision System
. AIAA SciTech. Source
BibTeX
@inproceedings{aaron2022camera, title = {Camera Simulation for the Perseverance Rover's Lander Vision System}, author = {Aaron, Seth and Cheng, Yang and Trawny, Nikolas and Mohan, Swati and Montgomery, James and Ansari, Homayoon and Smith, Ken and Johnson, Andrew and Goguen, Jay and Zheng, Jason}, booktitle = {AIAA SciTech}, publisher = {JPL Open Repository}, year = {2022}, url = {https://dataverse.jpl.nasa.gov/dataset.xhtml?persistentId=hdl:2014/56110} } - Johnson, A. E., Cheng, Y., Trawny, N., Montgomery, J. F., Schroeder, S., Chang, J., Clouse, D., Aaron, S. and Mohan, S. (2023). A Map Relative Localization System for Planetary Landing
. Journal of Guidance, Control, and Dynamics. Source
BibTeX
@article{johnson2023map, title = {A Map Relative Localization System for Planetary Landing}, author = {Johnson, Andrew E. and Cheng, Yang and Trawny, Nikolas and Montgomery, James F. and Schroeder, Steven and Chang, Johnny and Clouse, Daniel and Aaron, Seth and Mohan, Swati}, journal = {Journal of Guidance, Control, and Dynamics}, publisher = {JPL Open Repository}, year = {2023}, doi = {10.48577/jpl.twou9p}, abstract = {The Mars 2020 Entry Descent and Landing (EDL) system successfully delivered the Perseverance rover to the surface of Mars on February 18th, 2021. A large fraction of the 8km wide Jezero Crater landing ellipse is covered with landing hazards including cliffs, inescapable dune fields and rocks. To mitigate the risk of these hazards, a novel Terrain Relative Navigation system was developed and integrated with the heritage Mars Science Laboratory EDL system. First the hazards were identified or inferred using orbital imagery and stored on-board the spacecraft as a hazard map. During parachute descent, the Lander Vision System (LVS) estimated map relative position by fusing landmarks matched between descent imagery and a map of the landing site with inertial measurement unit data. This position estimate and the hazard map were used by the powered descent guidance and control system to identify and then fly to the safest target for landing that was also reachable given fuel and other constraints. Post-flight analysis indicated that the horizontal error between the targeted location and actual landing location was 5m relative to a 60m requirement, which indicated that all required systems worked much better than designed. In particular, the fully autonomous LVS generated a position estimate in 10s that was in error by only a few meters relative to a 40m requirement. This paper describes the LVS design, how it was tested before launch and the LVS performance during EDL.} } - Trawny, N., Johnson, A. E., Bailey, E., Massone, G., Reid, M., Setterfield, T. P., Cheng, Y., Sellar, G. and Soto, J. (2024). The Enhanced Lander Vision System for Mars Sample Retrieval Lander Entry Descent and Landing
. AIAA SciTech. Source
BibTeX
@inproceedings{trawny2024enhanced, title = {The Enhanced Lander Vision System for Mars Sample Retrieval Lander Entry Descent and Landing}, author = {Trawny, Nikolas and Johnson, Andrew E. and Bailey, Erik and Massone, Gabrielle and Reid, Mark and Setterfield, Timothy P. and Cheng, Yang and Sellar, Glenn and Soto, Jose}, booktitle = {AIAA SciTech}, publisher = {JPL Open Repository}, year = {2024}, doi = {10.48577/jpl.ke7iqw}, abstract = {As part of the Mars Sample Return Campaign, the Sample Retrieval Lander (SRL) would receive a set of Martian rock samples collected by the Perseverance rover and send them into Mars orbit for later recovery and return to Earth. SRL is being designed to perform pin-point landing within 60 m of a pre-selected landing target without relying on a landing Doppler radar sensor. Building on the successful landing of Perseverance that demonstrated terrain relative navigation using the Lander Vision System (LVS), SRL’s Enhanced Lander Vision System (ELViS) would function as the primary integrated navigation sensor system during Entry, Descent, and Landing. ELViS would provide horizontal position, altitude, and 3D velocity estimates to the Guidance and Control system, from the heading alignment subphase of hypersonic entry to 50 m altitude above the ground. This paper describes the ELViS preliminary flight design for SRL, including concept of operations, hardware, and software architecture, as well as the expected navigation performance.} } - Johnson, A. E., Trawny, N., Setterfield, T. P., Cheng, Y., Nash, J., Clouse, D., Massone, G. and San Martin, M. (2025). Challenges and Solutions for Early Morning Terrain Relative Navigation on Mars
. Scitech. Source
BibTeX
@inproceedings{johnson2025challenges, title = {Challenges and Solutions for Early Morning Terrain Relative Navigation on Mars}, author = {Johnson, Andrew E. and Trawny, Nikolas and Setterfield, Timothy P. and Cheng, Yang and Nash, Jeremy and Clouse, Daniel and Massone, Gabrielle and San Martin, Miguel}, booktitle = {Scitech}, publisher = {JPL Open Repository}, year = {2025}, doi = {10.48577/jpl.0elxjq}, abstract = {Launching the Mars Sample Return Lander (SRL) in 2031 or 2033 would necessitate a landing in the early morning. This is outside the operational envelope of the successful Mars 2020 Terrain Relative Navigation that would be required by SRL for accurate landing at pre-determined safe zones. This paper first uses terrestrial field test and orbital Mars imagery to quantify the sensitivity of landmark matching to sun illumination differences between the reference map and descent images. It then proposes two novel methods for predicting the appearance of an early morning reference map from the available afternoon orbital imagery. The predicted reference maps boost the number of correct landmark matches by a factor of four to show that early morning landing is feasible for SRL without dramatic changes to the on-board algorithms.} } - Johnson, A. E. and Montgomery, J. F. (2008). Overview of terrain relative navigation approaches for precise lunar landing
. IEEE Aerospace Conference. Source
BibTeX
@inproceedings{johnson2008overview, title = {Overview of terrain relative navigation approaches for precise lunar landing}, author = {Johnson, Andrew E. and Montgomery, James F.}, booktitle = {IEEE Aerospace Conference}, pages = {1-10}, publisher = {IEEE}, year = {2008}, doi = {10.1109/aero.2008.4526302} } - Johnson, A. E., Cheng, Y., Montgomery, J., Trawny, N., Tweddle, B. and Zheng, J. (2015). Real-time terrain relative navigation test results from a relevant environment for Mars landing
. AIAA Guidance, Navigation, and Control Conference. Source
BibTeX
@inproceedings{johnson2015real, title = {Real-time terrain relative navigation test results from a relevant environment for Mars landing}, author = {Johnson, Andrew E. and Cheng, Yang and Montgomery, James and Trawny, Nikolas and Tweddle, Brent and Zheng, Jason}, booktitle = {AIAA Guidance, Navigation, and Control Conference}, publisher = {American Institute of Aeronautics and Astronautics}, year = {2015}, doi = {10.2514/6.2015-0851}, abstract = {Terrain Relative Navigation (TRN) is an on-board GN&C function that generates a position estimate of a spacecraft relative to a map of a planetary surface. When coupled with a divert, the position estimate enables access to more challenging landing sites through pin-point landing or large hazard avoidance. The Lander Vision System (LVS) is a smart sensor system that performs terrain relative navigation by matching descent camera imagery to a map of the landing site and then fusing this with inertial measurements to obtain high rate map relative position, velocity and attitude estimates. A prototype of the LVS was recently tested in a helicopter field test over Mars analog terrain at altitudes representative of Mars Entry Descent and Landing conditions. TRN ran in real-time on the LVS during the flights without human intervention or tuning. The system was able to compute estimates accurate to 40m (3 sigma) in 10 seconds on a flight like processing system. This paper describes the Mars operational test space definition, how the field test was designed to cover that operational envelope, the resulting TRN performance across the envelope and an assessment of test space coverage.} } - Mohan, S., Johnson, A. E., Brugarolas, P., Cheng, Y., Otero, R., Trawny, N., Aaron, S., Serricchio, F., Montgomery, J., Casoliva, J. and Chen, A. (2021). Assessment of M2020 Terrain Relative Landing Accuracy: Flight Performance vs Predicts
. AAS/AIAA Astrodynamics Specialist Conference. Source
BibTeX
@inproceedings{mohan2021assessment, title = {Assessment of M2020 Terrain Relative Landing Accuracy: Flight Performance vs Predicts}, author = {Mohan, Swati and Johnson, Andrew E. and Brugarolas, Paul and Cheng, Yang and Otero, Richard and Trawny, Nikolas and Aaron, Seth and Serricchio, Fred and Montgomery, James and Casoliva, Jordi and Chen, Allen}, booktitle = {AAS/AIAA Astrodynamics Specialist Conference}, publisher = {JPL Open Repository}, year = {2021}, url = {https://dataverse.jpl.nasa.gov/dataset.xhtml?persistentId=hdl:2014/55252} } - Matthies, L., Daftry, S., Rothrock, B., Davis, A., Hewitt, R., Sklyanskiy, E., Delaune, J., Quadrelli, M., Schutte, A., Malaska, M. and Yurtsever, J. (2020). Terrain Relative Navigation for Guided Descent on Titan
. IEEE Aerospace Conference. Source
BibTeX
@inproceedings{matthies2020terrain, title = {Terrain Relative Navigation for Guided Descent on Titan}, author = {Matthies, Larry and Daftry, Shreyansh and Rothrock, Brandon and Davis, Anthony and Hewitt, Robert and Sklyanskiy, Evgeniy and Delaune, Jeff and Quadrelli, Marco and Schutte, Aaron and Malaska, Michael and Yurtsever, Joshua}, booktitle = {IEEE Aerospace Conference}, pages = {1-16}, publisher = {IEEE}, year = {2020}, doi = {10.1109/aero47225.2020.9172286}, abstract = {Titan's dense atmosphere, low gravity, and high winds at high altitudes create descent times of >90 minutes with standard entry/descent/landing (EDL) architectures and result in large unguided landing ellipses, with 99% values of ~110×110 km and 149×72 km in recent Titan lander proposals. Enabling precision landing on Titan could increase science return for the types of missions proposed to date and make additional types of landing sites accessible, opening up new possibilities for science investigations. Precision landing on Titan has unique challenges, because the hazy atmosphere makes it difficult to see the surface and because it requires guided descent with divert ranges that are one to two orders of magnitude larger than needed for other target bodies, i.e. up to on the order of 100 km. It is conceivable that such a divert capability could be provided economically by a parafoil or other steerable aerodynamic decelerator deployed several 10s of km above the surface. The long descent times lead to large inertial navigation errors, hence a need for terrain relative navigation (TRN). This would require a TRN capability that can operate at such altitudes, despite challenges of seeing the surface sufficiently clearly and of depending on map products that are two orders of magnitude lower in spatial resolution than those for Mars and airless bodies. This paper addressed the TRN problem for Titan guided descent, assuming parafoil deployment at an altitude around 40 km. We define a notional sensor suite including an inertial measurement unit (IMU), a radar altimeter, and two descent cameras, with spectral responses in the visible/near infrared (VNIR) (~0.5 to 1 um) and short wave infrared (SWIR) (~2.0 to 2.1 um), Due to the low resolution of current Titan map products, we define two altitude regimes (above and below ~20 km) that need different navigation techniques. Map matching is applicable in the upper regime, but challenging or infeasible in the lower one. Feature tracking with decent imagery is desirable in the lower regime, but challenging in the upper one. We derive image contrast requirements for TRN from prior literature and create models of achievable image contrast by radiative transfer modeling; this shows that the requirements should be achievable for a SWIR descent camera in the upper regime, and that a VNIR descent camera is preferable in the lower regime. We then develop algorithms for map matching and feature tracking with descent images and test these with synthetic images created from Cassini/Huygens data sets and our radiative transfer model. We also introduce new possibilities for TRN based on the potential to discriminate some specific types of terrain onboard in descent imagery, such as lake vs adjacent ground and dune vs interdune. We use sensor measurement noise models in simulations of state estimation with an extended Kalman filter that includes coordinates of a set of tracked features in the state vector. Case studies were done for two notional landing sites, one in a site with only dry ground and one in a Titan lake district. In both cases, the filter error model shows 3σ position error at touchdown on the order of 2 km. More work is needed to validate these results with higher fidelity camera models and larger data sets, but this is very promising.} } - Ishida, T., Fukuda, S., Kariya, K., Kamata, H., Takadama, K., Kojima, H., Sawai, S. and Sakai, S. (2025). Vision-based navigation and obstacle detection flight results in SLIM lunar landing
. Acta Astronautica. Source
BibTeX
@article{ishida2025vision, title = {Vision-based navigation and obstacle detection flight results in SLIM lunar landing}, author = {Ishida, Takayuki and Fukuda, Seisuke and Kariya, Kazuki and Kamata, Hiroyuki and Takadama, Keiki and Kojima, Hirohisa and Sawai, Shujiro and Sakai, Shinichiro}, journal = {Acta Astronautica}, volume = {226}, pages = {772-781}, publisher = {Elsevier BV}, year = {2025}, doi = {10.1016/j.actaastro.2024.11.002}, abstract = {On January 20, 2024, Smart Lander for Investigating Moon (SLIM) landed on the Moon. Vision-Based Navigation (VBN) was used to estimate the position of the spacecraft accurately and autonomously during the descent phase, and it was successfully used in each of the seven regions. Obstacle detection was also performed 50 m above the lunar surface, successfully identifying safe points within the field of view of the navigation camera. As a result, SLIM was the first mission to realize pinpoint lunar landing technology with 100 m accuracy. This paper details the VBN operational concept and developed components, as well as the flight results of VBN in SLIM’s lunar landing operations. • SLIM successfully landed on the Moon, achieving the first pinpoint landing. • Vision-based navigation provided precise position information to the probe. • Obstacle detection successfully identified a safer site within the field of view. • The landing accuracy 50 m above the lunar surface was 3 to 4 m.} } - Vander Hook, J., Schwartz, R., Ebadi, K., Coble, K. and Padgett, C. (2022). Topographical Landmarks for Ground-Level Terrain Relative Navigation on Mars
. IEEE Aerospace Conference. Source
BibTeX
@inproceedings{vanderhook2022topographical,
  title = {Topographical Landmarks for Ground-Level Terrain Relative Navigation on Mars},
  author = {Vander Hook, Joshua and Schwartz, Russell and Ebadi, Kamak and Coble, Kyle and Padgett, Curtis},
  booktitle = {IEEE Aerospace Conference},
  pages = {1-6},
  address = {Big Sky, Montana},
  year = {2022},
  doi = {10.1109/aero53065.2022.9843350},
  abstract = {Many of the tasks planned for future generation Mars rovers rely heavily on having accurate knowledge of the rover's location in a Martian body-fixed coordinate system. Current solutions for localization require regular human intervention in order to detect and rectify drift, and thus stand to benefit from systems that can run in real-time on the rover itself. We study the feasibility and performance of an automated approach to localization in which the rover makes bearing-only measurements to geographic features in its surroundings (hills, boulders, peaked ridge-lines, etc.). When the location of these landmarks can be cross-referenced with a map of Mars, the resulting solution will be globally registered and will help correct any drift during visual-odometry-aided drives. This paper studies two related problems: First, how can we locate geographic features that the rover can feasibly see, when provided an elevation map of the surrounding terrain? We provide a software tool that can extract features from elevation maps for comparison to imagery. However, once these landmarks are identified, it is not obvious if a given path for the rover will contain sufficient features to navigate autonomously. Accuracy will depend on the quantity, range, and relative geometry of landmarks that are available. Thus, the second contribution is to provide a GIS plugin that analyzes the terrain informativeness of large operating areas as well as more specific paths. We present an analysis of Jezero Crater in which Perseverance's Navcam is used as the hypothetical sensor. In certain favorable regions, worst-case localization accuracy in the 10 meter range is achieved from a single set of measurements (comparable to GPS on Earth). The map overlays generated by this analysis have the potential to aid in long-term mission planning by highlighting broad areas of high or low informativeness. These tools are computationally efficient and will be made open source to allow Mars mission planners, formulation studies, and rover drivers to plan for any future image-based self-localization capability.}
}