Martian Surface Environment
The Martian surface is a 3.72 m/s2 gravity field [1] under a thin, almost pure carbon dioxide atmosphere at roughly 1 percent of Earth sea-level density, permanently loaded with suspended dust, with no global magnetic field and only a few tens of g/cm2 of atmospheric column shielding the ground. Surface hardware has to survive a diurnal temperature swing set by regolith thermal inertia, dust that degrades solar arrays and optics, and ground whose strength varies from loose sand to cemented crust, and has been flown there repeatedly [27][30].
Planetary and orbital parameters
Section titled “Planetary and orbital parameters”| Quantity | Value | Source |
|---|---|---|
| Gravitational parameter GM | 42828 km³/s² | [1] |
| Mean equatorial radius | 3396.2 km | [1] |
| Mean polar radius | 3376.2 km | [1] |
| Oblateness term J2 | 0.00196045 | [1] |
| Sidereal rotation period | 88642.44 s (24 h 37 min 22 s) | [1] |
| Mean solar day (sol) | 88775 s (24 h 39 min 35 s) | [1] |
| Surface gravity | 3.72 m/s² | [1] |
| Orbital period | 686.98 Earth days, 668.6 sols | [1] |
| Obliquity | 25.19 deg | [1] |
| Orbital eccentricity | 0.0934 | [1] |
Season is expressed as areocentric solar longitude L_s, with L_s = 0 at northern spring equinox, and the engineering atmosphere model is parameterized on L_s, latitude, longitude and local time rather than on calendar date [1]. Eccentricity of 0.0934 places southern summer near perihelion, so the perihelion half of the year carries both higher insolation and, as set out below, the dust storm season.
Atmosphere
Section titled “Atmosphere”Near-surface composition in Mars-GRAM is 94.8 percent CO2, 3.1 percent N2 and 1.9 percent Ar by mole fraction [1]. Measured surface pressure at the Viking lander sites ranged over 700 to 1100 Pa across the year [2]; at Gale crater, at an elevation of about 4.4 km below datum, Curiosity recorded 400 to 1200 Pa. The annual swing is driven by CO2 condensing onto and subliming from the seasonal polar caps, which is an exchange of total atmospheric mass rather than a local weather signal. The gradient with elevation is steep enough to be measured by a rover in motion: an elevation gain of 184 m over 1526 sols produced a pressure fall of about 15 Pa at Gale [2]. The atmospheric scale height at Gale is 11.1 km [10].
Diurnal pressure tides at equatorial sites have amplitudes of roughly 1 to 2 Pa near aphelion and about 5 Pa near perihelion, with the amplitude tracking dust opacity [2].
Design analyses are run against Mars-GRAM, which outputs temperature, pressure, density, wind components and constituent fractions [1]. It is a composite of three data sources: the NASA Ames MGCM from the surface to 80 km, the Michigan MTGCM from 80 km to 170 km (or 240 km for the TES-derived map years), and the Stewart thermospheric model above 170 km, whose base sits at the 1.26 nbar level near 125 km. Stored data are gridded at 5 km in altitude, 7.5 deg in latitude for MGCM and 5 deg for MTGCM, and 30 deg in L_s. The 2024 release upgraded the MOLA topography model to read the higher resolution Planetary Data System data, defaulting to 4 pixels per degree with 16, 32 and 64 pixels per degree also selectable [1]. Solar activity enters through F10.7, with 70 and 130 (10⁻²² W/cm² at 1 AU) as the low and high inputs and 200 available for the TES map years.
Mars-GRAM returns a perturbed density as rho’ = rho0 (1 + Rc’ PF PU), a correlated random walk about the mean profile [1]. The dispersion, not the mean, is what sizes landing ellipses and control authority. The model has been maintained since version 1.00 of 20 May 1988 [1].
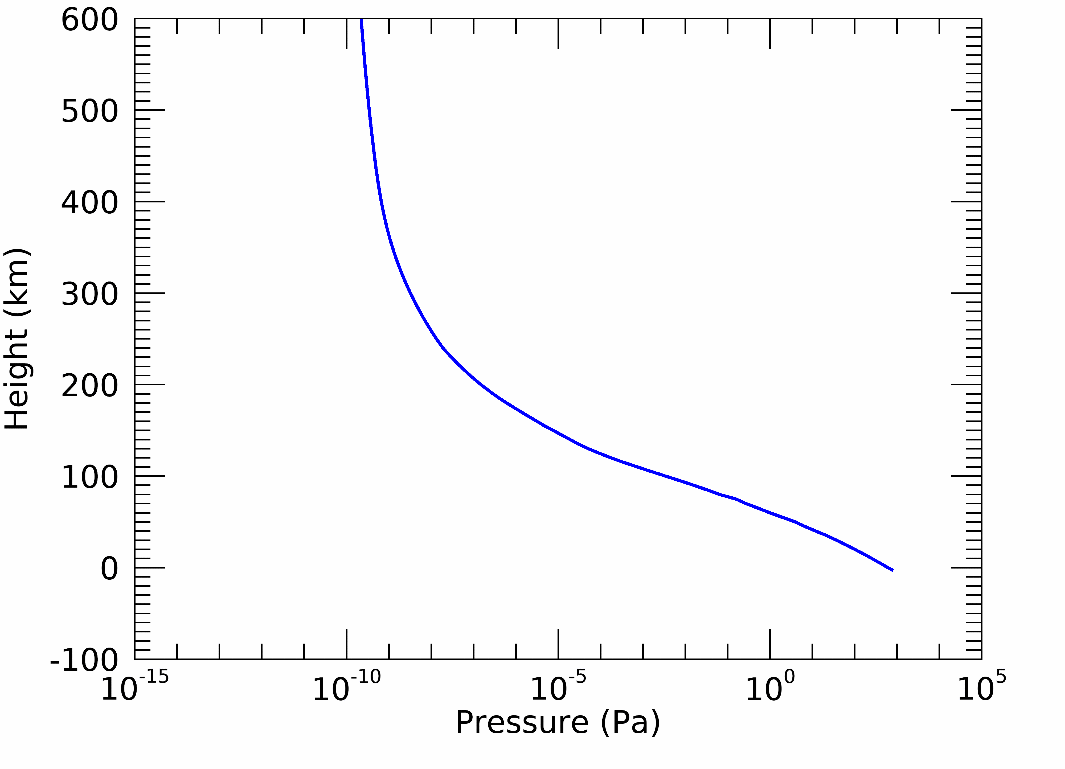
Mars-GRAM sample output [1]: pressure against height from the surface to 600 km, spanning roughly fourteen decades and joining three separate data sources. Public domain (NASA).
Aerodynamic regime
Section titled “Aerodynamic regime”Mean surface density is about 0.020 kg/m³, near 1 percent of Earth sea level [14]. For rotary-wing flight this places blade sections at chord Reynolds numbers of order 10⁴ against order 10⁶ for terrestrial rotorcraft, while the low speed of sound pushes tip Mach numbers high enough that the same section is simultaneously in a low-Reynolds and a compressible regime [13][14]. Wind tunnel measurement of Mars rotor airfoils is therefore done at combined conditions such as Re = 20,000 and M = 0.60, in a chamber held at 1 kPa and 288 K [13]. Peak sectional lift-to-drag ratio for an optimized Mars airfoil under those conditions is approximately 26, reached near 4.5 deg angle of attack, against values several times higher for a conventional airfoil at terrestrial Reynolds numbers.
Winds and the boundary layer
Section titled “Winds and the boundary layer”| Quantity | Value | Source |
|---|---|---|
| Measured wind speed span, Curiosity sensor | 0 to 150 m/s | [2] |
| Wind speed accuracy, Curiosity | ±1 m/s below 20 m/s, ±4 m/s above | [2] |
| Expected wind speeds at Jezero | 0.5 to 30 m/s | [8] |
| Convective vortex pressure drop | 0.1 to 10 Pa, characteristic 0.6 Pa | [4] |
| Convective cell pressure fluctuation | 0.1 Pa, period approx 100 s | [4] |
| Saltation shear stress threshold | 0.01 ± 0.0015 N/m² | [11] |
Wind speeds peak in daytime at every landed site, following convective mixing, and the seasonal maximum at the Viking Lander 2 site (47.9 N) falls in late northern winter near L_s = 345 deg [2].
InSight logged approximately 6000 convective vortex encounters in its first 400 sols, against a detection threshold of 0.3 Pa; the amplitude distribution follows a power law with exponent 3.4, so large-amplitude vortices are rare but not negligible [4]. Large-eddy simulations matched to that record used a model top at 10 km, roughly twice the expected daytime boundary layer depth.
The threshold for sustained saltation, calibrated from seasonal dune sand flux at Nili Patera, is a surface shear stress of 0.01 ± 0.0015 N/m² [11]. Sand flux there is about three times larger in southern summer than northern summer, following the perihelion insolation and wind cycle. That threshold sets both the surface mobility of loose deposits and the wind conditions under which deposited dust can be removed from a horizontal surface.
Column dust optical depth is the standard scalar for atmospheric dust loading. Gridded climatologies normalize it to the 610 Pa pressure level so that values from sites at different elevations are comparable [3]. Retrievals assume a particle effective radius of 1.06 µm with effective variance 0.3, and infrared absorption-only opacities are converted to visible extinction opacity by a factor of 2.6.
| Condition | Column optical depth | Source |
|---|---|---|
| Aphelion season, L_s 0 to 180 | tau < 1; interannual sigma 0.03 to 0.05 | [2] |
| L_s 240 to 250 window | 0.35 ± 0.08 (IR absorption, 610 Pa) | [3] |
| Global storm, global mean peak | approx 4 at L_s 205 to 210 (MY34) | [9] |
| Global storm, local values | 5 to 10 | [9] |
| Historic maxima | tau > 3 at L_s approx 300 (MY12) and L_s approx 280 (MY28) | [2] |
Dust storm season runs L_s 185 to 300 [9]. Two windows of enhanced regional activity recur each year, at L_s 210 to 240 and L_s 320 to 340, with a third at L_s 150 to 170 observed over Gusev crater [2]. During the MY34 planet-encircling event dust was lofted to 80 km altitude [9].
Surface optical effects during a global storm are measurable directly. At Gale, horizontal line-of-sight extinction reached 1.15 km⁻¹ on sol 2088, against a pre-storm seasonal amplitude of 0.06 km⁻¹ and mean peak values of 0.11 km⁻¹ [10].
Dust loading also compresses the diurnal thermal cycle. During the 1977 global storm the diurnal air temperature amplitude at Viking Lander 1 fell from 42 K to 12 K near L_s = 275 deg [2]. Suspended dust absorbs and scatters in the visible, reducing direct-beam flux and raising the diffuse fraction, and warms the middle atmosphere, which changes the density profile at entry altitudes.
Deposition onto horizontal surfaces is cumulative and, absent wind at or above the saltation threshold, monotonic [11]. Removal by gusts and vortex passage is stochastic and is not a budgetable mechanism.
Thermal environment
Section titled “Thermal environment”| Quantity | Value | Source |
|---|---|---|
| Air temperature measurement span, Viking | 140 to 280 K | [2] |
| Air temperature span, Curiosity | 150 to 300 K | [2] |
| Seasonal air temperature amplitude, 47.9 N | approx 60 K | [2] |
| Seasonal amplitude, 22.4 N | approx 30 K | [2] |
| Seasonal amplitude, 4.6 S | approx 20 K | [2] |
| Peak ground temperature, 68.2 N (Phoenix) | approx 259 K at L_s 107 | [2] |
| Minimum ground temperature at 15 mm depth, Phoenix | approx 180 K at L_s 133 | [2] |
| Annual amplitude of mean ground temperature, Gale | approx 20 K | [2] |
| Thermal inertia, Gale terrain | 170 to 550 J m⁻² K⁻¹ s⁻¹ᐟ² | [2] |
Thermal inertia at Yellowknife Bay was 300 to 420 J m⁻² K⁻¹ s⁻¹ᐟ², within that range [2]. Atmospheric heat capacity at 600 Pa is too small to buffer the surface overnight, and convective coupling is weak, so surface temperature tracks insolation and the diurnal range is set largely by the thermal inertia of the surface material.
The same quantity has been measured on Mars and in a chamber on the same terrain classes, which is rare for a soil property. Perseverance TIRS diurnal surface temperature over a whole sol gives apparent thermal inertia of 574 for bedrock, 456 for intermediate and 348 for sandy terrain, against 535, 421 and 375 for visually equivalent soils cycled in an 8 mbar CO2 Mars chamber at the University of Malaga, all in J m⁻² K⁻¹ s⁻¹ᐟ² and all through the same sinusoidal inversion [19]. Agreement is within 8 percent, but the terrain matching is by visual resemblance in Navcam imagery rather than by measured composition, so this is suggestive rather than a calibration.
Pressure is what makes the chamber run worth doing at Mars pressure. Across four soils of 0.7 to 50 mm granularity, the spread in estimated thermal inertia between the highest and lowest soil was 4.20 percent at 1000 mbar and 42.84 percent at 8 mbar [19]. Thermal discrimination between soils is therefore about ten times more sensitive at Mars pressure than at Earth pressure, because vertical heat transport through the grain bed is markedly poorer: the maximum surface to subsurface temperature difference measured on embedded thermocouples rose from 11.6 to 14.7 C for the 3 to 5 mm soil and from 14.4 to 24.4 C for the 0.7 to 1.0 mm soil when pressure was dropped. A sandbox validation of a thermal soil assessment sensor at ambient pressure understates what it will do on Mars.
Relative humidity at Gale peaks between 04:00 and 06:00 local mean solar time and falls below 5 percent between 10:00 and 18:00 [2]. Water vapor volume mixing ratio at Gale reaches approximately 70 ppm at night in late winter through early summer and falls below 5 ppm in late autumn and winter.
The MEDA suite on Perseverance defines the achievable measurement envelope for these quantities: air temperature over 150 to 300 K to ±1 K at 0.1 K resolution, pressure over 1 to 1400 Pa to ±20 Pa across the 400 to 1200 Pa band at 0.08 to 0.32 Pa resolution, and relative humidity over 0 to 100 percent across 190 to 270 K, degrading to ±20 percent RH at 190 to 200 K [8].
Regolith and surface materials
Section titled “Regolith and surface materials”Surface materials span consolidated bedrock, cemented duricrust, indurated soils, and loose aeolian sand and drift.
| Property | Value | Source |
|---|---|---|
| Cohesion, Martian sand | ≤ 1 kPa | [6] |
| Cohesion, drift and crusty-to-cloddy and blocky indurated soil | up to 11 kPa | [6] |
| Cohesion, duricrust from mole-pit slope stability at 30 deg friction | 5.8 kPa | [6] |
| Cohesion from mole penetration resistance, friction 30 to 40 deg | 4 to 25 kPa | [6] |
| Friction angle, Martian sand | approx 30 deg, lower for drift | [6] |
| Bulk density, sand (pre-InSight estimates) | 1000 to 1500 kg/m³ | [6] |
| Bulk density, top 400 mm at InSight (TEM-A) | 1211 (+149/−127) kg/m³ | [6] |
| Crustal rock density | 2800 to 3200 kg/m³, extremes to 3700 | [6] |
| Implied porosity | approx 63 percent | [6] |
| Penetration resistance, duricrust | 0.5 to 1.2 MPa | [7] |
| Penetration resistance below 300 mm | 5.3 MPa | [7] |
| Shear modulus | 4.32 ± 1.01 MPa | [7] |
| Bulk modulus | 9.84 ± 6.54 MPa | [7] |
| Young’s modulus | 11.30 ± 2.87 MPa | [7] |
| Poisson ratio | 0.31 ± 0.15 | [7] |
Duricrust thickness is the parameter that has been most consistently underestimated. Prior to InSight, landed observations supported a cemented layer no more than a few centimeters thick over loose sand, and hardware was designed to punch through it [6]. At Homestead hollow the crust was at least 70 mm thick from visual inspection of the excavated pit, approximately 200 mm from the length of mole extraction during back-hammering, and possibly as deep as the 370 mm final tip depth, and the walls of that pit stood at 87 deg, which is itself a cohesion measurement [6]. Orbital thermal inertia at that site showed no duricrust signature, so thermal inertia is not by itself a reliable discriminator for cemented near-surface material.
Thermal conductivity of the regolith is low and layered: 14 mW/m/K near the surface, 34 mW/m/K within the crust, and 64 mW/m/K in the sand and gravel beneath [7]. Buried hardware is therefore poorly coupled to the deep ground and remains dominated by the diurnal wave in the upper layers.
Two hazard classes follow from the material range. Low-cohesion aeolian deposits fail in bearing and allow sinkage and slip. Embedded angular rock in indurated material or bedrock does not yield under load and acts as a rigid indenter, concentrating the full contact load on a small area.
Ionizing radiation
Section titled “Ionizing radiation”The atmosphere provides a column depth of approximately 22 to 23 g/cm² over Gale crater, which sits 4.431 km below datum [5][12]. That column is thin enough that only protons above roughly 160 to 200 MeV reach the surface as primaries [12]. Earth’s atmosphere presents approximately 1030 g/cm² by comparison. There is no global magnetic field, and crustal remanent magnetism is localized.
| Quantity | Value | Source |
|---|---|---|
| Surface absorbed dose rate, BON2014 GCR model | 0.172 mGy/day | [5] |
| Surface absorbed dose rate, DLR2013 GCR model | 0.177 mGy/day | [5] |
| Surface dose equivalent rate, BON2014 | 0.539 mSv/day | [5] |
| Surface dose equivalent rate, DLR2013 | 0.560 mSv/day | [5] |
| Atmospheric column depth, baseline and range | 23 g/cm², 20.4 to 24.1 g/cm² | [5] |
| Dose sensitivity to that column range | within 3 percent | [5] |
| Solar modulation parameter, baseline | 572 MV | [5] |
Dose responds far more strongly to solar modulation than to atmospheric thickness: a ±20 percent change in the modulation parameter changes surface dose by about 20 percent, while the full plausible range of atmospheric column depth moves it by under 3 percent [5]. Roughly half the surface neutron field is produced by albedo from the regolith rather than in the atmosphere, so the ground under a vehicle is part of its radiation environment. Neutrons below 1 MeV contribute under 10 percent of effective dose behind moderate shielding [5]. The MSL/RAD measurement campaign underlying these model comparisons is collected in [15], and surface dose accumulation derived from the same record is treated in [16].
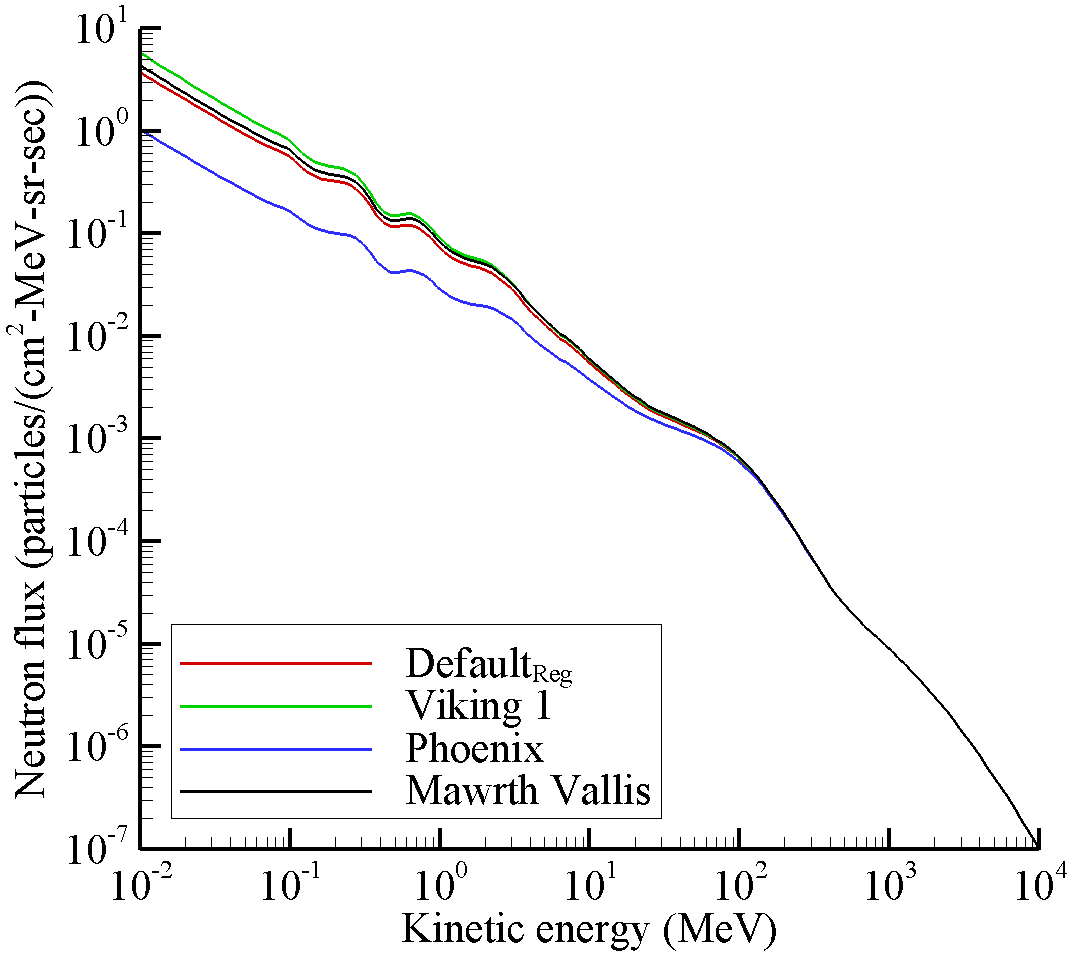
Modeled neutron flux at the Martian surface against kinetic energy for four regolith compositions [5]. The spread below 10 MeV is regolith albedo; the field above 100 MeV is insensitive to surface composition. Public domain (NASA).
Surface operations: what has flown
Section titled “Surface operations: what has flown”Landed missions are the engineering test of the environment. Sojourner, Spirit, Opportunity, Curiosity, Zhurong and Perseverance span 11.5 kg to 1025 kg, and Opportunity accumulated 45,160 m over 5352 sols [26]. Mission-by-mission outcomes for every Mars attempt since 1958 are chronicled in [27], and the planetary science decadal survey sets the cost and technology constraints under which the following decade’s surface hardware was designed [29]. The MER mission summary [30] gives the landing-site context for the soil properties tabulated above; neither [27], [29] nor [30] supplies an engineering value.
Power. Opportunity’s array energy fell from 660 W-hr to 22 W-hr, a 96.7 percent drop, as column optical depth rose from 0.611 to 10.8 over eight sols, ending contact at sol 5111 [21]. Opportunity’s radioisotope heater units retained 89.3 percent of their plutonium-238 after 14.37 years, leaving 0.89 W thermal [21]. The Mars surface solar spectrum at 60 deg zenith, optical depth 0.5, is red-shifted relative to AM0; triple-junction cells with a retuned top subcell gained 4.4 percent power over AM0-optimized cells under a filtered xenon simulator, with no cell measured on Mars [22].
Environment assessment for a landing. For Gale crater, MSL certified the site for a 900 kg rover and a 25 by 20 km 3-sigma ellipse using general circulation and mesoscale models validated against orbital data, with modeled mean surface pressure of 730 Pa at L_s = 150 deg and a prescribed 500 km “dust bomb” storm of visible opacity 2.5 as the worst case [20]. These are model outputs and constructed bounding cases, not observed statistics [20].
Telecommunications. Landed assets rely on orbiter UHF relay because of power and mass limits, under an international Proximity-1 framework [28]. For the Mars Global Surveyor relay, pre-flight predictions gave 2.5 Mbytes per sol at the equator and 9.0 Mbytes per sol at 70 deg south at 8 kbps, and 17.2 minutes per sol of contact for a battery-free rover transmitting only above 30 deg sun elevation against 51.8 minutes without that limit [23]. These are 1997 predictions of a link not yet closed.
Mobility and sampling. Curiosity drove 21,318.5 m in 738 attempted drives over seven years, with 60.75 percent of driving uphill, mean slip of 6.24 percent, and visual odometry used in 88 percent of driving [24]. Phoenix found indurated icy layers 2 to 10 cm below the surface in nearly all of its workspace; its 2.4 m, 4 DOF arm executed 53 dig sequences, hit the ice table about 3 cm down in the Snow White trench, and needed three attempts to deliver an icy sample because the first two congealed in the scoop [25]. A recent survey tabulates Ingenuity at 72 flights over 17.0 km in an atmosphere under 1 percent of Earth’s [26].
Entry and descent consequences
Section titled “Entry and descent consequences”Surface gravity of 3.72 m/s² [1] acting with a mean surface density near 0.020 kg/m³ [14] sets the entry problem. The atmosphere is dense enough to require thermal protection and to make aerodynamic control usable, and thin enough that parachutes alone cannot decelerate a heavy vehicle to a survivable touchdown velocity. Powered descent is required above a mass threshold, and that threshold falls with landing site elevation because a higher site offers less column to decelerate through. Both the mean profile and its dispersion for these analyses come from Mars-GRAM [1], with dust optical depth entered either as a globally uniform value of tau = 0.3, 1.0 or 3.0, or as the dust optical depth observed by TES in retrieval year 1, which had no global dust storm, or year 2, which contained a major global storm peaking at L_s = 210 [1]. Design environments for program-level requirements are specified in [17], and the prior model release is [18].
What is not established
Section titled “What is not established”Most thermal, wind and pressure values above are from a small number of sites at low to mid latitudes and a few Mars years, so global extrapolation rests on Mars-GRAM [1], which supplies a dispersion model rather than a measured climatology. Duricrust thickness and cohesion are known from one site [6], and orbital thermal inertia did not flag the crust there. The saltation threshold is a model-calibrated effective value from one dune field and one Mars year [11]. The Perseverance and chamber thermal inertia agreement rests on visual terrain matching [19]. Surface dose figures come from model comparison and a measurement at one elevation [5][15], and crewed-mission budgets built from them are secondary compilations [16]. Solar cell spectral gains have not been measured on Mars [22], and telecom throughput figures are pre-flight predictions [23].
References
- Justh, H. L., Burns, K. L., Dutta, S. and Hoffman, J. (2024). Mars Global Reference Atmospheric Model (Mars-GRAM) 2024: User Guide
. NASA Marshall Space Flight Center. Source
BibTeX
@techreport{nasa2024mars, title = {Mars Global Reference Atmospheric Model (Mars-GRAM) 2024: User Guide}, author = {Justh, Hilary L. and Burns, K. L. and Dutta, Soumyo and Hoffman, J.}, institution = {NASA Marshall Space Flight Center}, year = {2024}, url = {https://ntrs.nasa.gov/citations/20240012934}, abstract = {This Technical Memorandum (TM) presents the Mars Global Reference Atmospheric Model (Mars-GRAM) 2024 and its updated features. Mars-GRAM is an engineering-oriented atmospheric model that estimates mean values and statistical variations of atmospheric properties for Mars. This TM summarizes the atmospheric data model in Mars-GRAM and provides a guide for the user to obtain, set up, and run the code in various configurations. Additional details regarding the Mars-GRAM input and output files and how to interpret Mars-GRAM results are also provided.} } - Martínez, G. M., Newman, C. N., De Vicente-Retortillo, A., Fischer, E., Renno, N. O., Richardson, M. I., Fairén, A. G., Genzer, M., Guzewich, S. D., Haberle, R. M., Harri, A.-M., Kemppinen, O., Lemmon, M. T., Smith, M. D., de la Torre-Juárez, M. and Vasavada, A. R. (2017). The Modern Near-Surface Martian Climate: A Review of In-situ Meteorological Data from Viking to Curiosity
. Space Science Reviews. Source
BibTeX
@article{martinez2017modern, title = {The Modern Near-Surface Martian Climate: A Review of In-situ Meteorological Data from Viking to Curiosity}, author = {Martínez, G. M. and Newman, C. N. and De Vicente-Retortillo, A. and Fischer, Erik and Renno, N. O. and Richardson, Mark I. and Fairén, A. G. and Genzer, Maria and Guzewich, Scott D. and Haberle, R. M. and Harri, Ari-Matti and Kemppinen, Osku and Lemmon, Mark T. and Smith, Michael D. and de la Torre-Juárez, M. and Vasavada, Ashwin R.}, journal = {Space Science Reviews}, volume = {212}, pages = {295--338}, year = {2017}, doi = {10.1007/s11214-017-0360-x}, abstract = {We analyze the complete set of in-situ meteorological data obtained from the Viking landers in the 1970s to today’s Curiosity rover to review our understanding of the modern near-surface climate of Mars, with focus on the dust, CO 2 and H 2 O cycles and their impact on the radiative and thermodynamic conditions near the surface. In particular, we provide values of the highest confidence possible for atmospheric opacity, atmospheric pressure, near-surface air temperature, ground temperature, near-surface wind speed and direction, and near-surface air relative humidity and water vapor content. Then, we study the diurnal, seasonal and interannual variability of these quantities over a span of more than twenty Martian years. Finally, we propose measurements to improve our understanding of the Martian dust and H 2 O cycles, and discuss the potential for liquid water formation under Mars’ present day conditions and its implications for future Mars missions. Understanding the modern Martian climate is important to determine if Mars could have the conditions to support life and to prepare for future human exploration.} } - Montabone, L., Forget, F., Millour, E., Wilson, R. J., Lewis, S. R., Cantor, B. A., Kass, D., Kleinböhl, A., Lemmon, M. T., Smith, M. D. and Wolff, M. J. (2015). Eight-year Climatology of Dust Optical Depth on Mars
. Icarus. Source
BibTeX
@article{montabone2015eight, title = {Eight-year Climatology of Dust Optical Depth on Mars}, author = {Montabone, L. and Forget, Francois and Millour, Ehouarn and Wilson, R. J. and Lewis, Stephen R. and Cantor, B. A. and Kass, D. and Kleinböhl, A. and Lemmon, Mark T. and Smith, Michael D. and Wolff, M. J.}, journal = {Icarus}, volume = {251}, pages = {65--95}, year = {2015}, doi = {10.1016/j.icarus.2014.12.034} } - Spiga, A., Murdoch, N., Lorenz, R., Forget, F., Newman, C., Rodriguez, S., Pla-Garcia, J., Moreiras, D. V., Banfield, D., Perrin, C., Mueller, N. T., Lemmon, M., Millour, E. and Banerdt, W. B. (2021). A study of daytime convective vortices and turbulence in the martian Planetary Boundary Layer based on half-a-year of InSight atmospheric measurements and Large-Eddy Simulations
. Journal of Geophysical Research: Planets. Source
BibTeX
@article{spiga2021study, title = {A study of daytime convective vortices and turbulence in the martian Planetary Boundary Layer based on half-a-year of InSight atmospheric measurements and Large-Eddy Simulations}, author = {Spiga, Aymeric and Murdoch, Naomi and Lorenz, R. and Forget, Francois and Newman, C. and Rodriguez, S. and Pla-Garcia, Jorge and Moreiras, D. Viúdez and Banfield, Don and Perrin, C. and Mueller, N. T. and Lemmon, M. and Millour, Ehouarn and Banerdt, W. Bruce}, journal = {Journal of Geophysical Research: Planets}, volume = {126}, year = {2021}, doi = {10.1029/2020je006511}, abstract = {Abstract Studying the atmospheric planetary boundary layer (PBL) is crucial to understand the climate of a planet. The meteorological measurements by the instruments onboard InSight at a latitude of 4.5°N make a unique rich data set to study the active turbulent dynamics of the daytime PBL on Mars. Here we use the high‐sensitivity continuous pressure, wind, and temperature measurements in the first 400 sols of InSight operations (from northern late winter to midsummer) to analyze wind gusts, convective cells, and vortices in Mars’ daytime PBL. We compare InSight measurements to turbulence‐resolving large‐eddy simulations (LES). The daytime PBL turbulence at the InSight landing site is very active, with clearly identified signatures of convective cells and a vast population of 6,000 recorded vortex encounters, adequately represented by a power law with a 3.4 exponent. While the daily variability of vortex encounters at InSight can be explained by the statistical nature of turbulence, the seasonal variability is positively correlated with ambient wind speed, which is supported by LES. However, wind gustiness is positively correlated to surface temperature rather than ambient wind speed and sensible heat flux, confirming the radiative control of the daytime Martian PBL; and fewer convective vortices are forming in LES when the background wind is doubled. Thus, the long‐term seasonal variability of vortex encounters at the InSight landing site is mainly controlled by the advection of convective vortices by ambient wind speed. Typical tracks followed by vortices forming in the LES show a similar distribution in direction and length as orbital imagery.} } - Wilson, J. W., Slaba, T. C., Badavi, F. F., Reddell, B. D. and Bahadori, A. A. (2017). Evaluation of HZETRN on the Martian Surface: Sensitivity Tests and Model Results
. Life Sciences in Space Research. Source
BibTeX
@article{wilson2017evaluation, title = {Evaluation of HZETRN on the Martian Surface: Sensitivity Tests and Model Results}, author = {Wilson, J. W. and Slaba, Tony C. and Badavi, F. F. and Reddell, Brandon D. and Bahadori, A. A.}, journal = {Life Sciences in Space Research}, volume = {14}, pages = {29-35}, institution = {NASA}, year = {2017}, doi = {10.1016/j.lssr.2017.03.001}, abstract = {The Mars Science Laboratory Radiation Assessment Detector (MSLRAD) is providing continuous measurements of dose, dose equivalent, and particle flux on the surface of Mars. These measurements have been highly useful in validating environmental and radiation transport models that will be heavily relied upon for future deep space missions. In this work, the HZETRN code is utilized to estimate radiation quantities of interest on the Martian surface. A description of the modeling approach used with HZETRN is given along with the various input models and parameters used to define the galactic cosmic ray (GCR) environment and Martian geometry. Sensitivity tests are performed to gauge the impact of varying several input factors on quantities being compared to MSLRAD data. Results from these tests provide context for inter-code comparisons presented in a companion paper within this issue. It is found that details of the regolith and atmospheric composition have a minimal impact on surface flux, dose, and dose equivalent. Details of the density variation within the atmosphere and uncertainties associated with specifying the vertical atmospheric thickness are also found to have minimal impact. Two widely used GCR models are used as input into HZETRN and it is found that the associated surface quantities are within several percent of each other.} } - Spohn, T., Hudson, T. L., Witte, L., Wippermann, T., Wisniewski, L., Kedziora, B., Vrettos, C., Lorenz, R. D., Golombek, M., Lichtenheldt, R., Grott, M., Knollenberg, J., Krause, C., Fantinati, C., Krueger, T. and Grygorczuk, J. (2022). The InSight-HP3 Mole on Mars: Lessons Learned from Attempts to Penetrate to Depth in the Martian Soil
. Advances in Space Research, 8. Source
BibTeX
@article{spohn2022insight, title = {The InSight-HP3 Mole on Mars: Lessons Learned from Attempts to Penetrate to Depth in the Martian Soil}, author = {Spohn, Tilman and Hudson, Troy L. and Witte, Lars and Wippermann, Torben and Wisniewski, Lukasz and Kedziora, Bartosz and Vrettos, Christos and Lorenz, Ralph D. and Golombek, Matthew and Lichtenheldt, Roy and Grott, Matthias and Knollenberg, Joerg and Krause, Christian and Fantinati, Cinzia and Krueger, Torsten and Grygorczuk, Jerzy}, journal = {Advances in Space Research}, volume = {69}, number = {8}, pages = {3140--3163}, year = {2022}, doi = {10.1016/j.asr.2022.02.009}, abstract = {The NASA InSight lander mission to Mars payload includes the Heat Flow and Physical Properties Package HP3 to measure the surface heat flow. The package was designed to use a small penetrator - nicknamed the mole - to implement a vertical string of temperature sensors in the soil to a depth of 5 m. The mole itself is equipped with sensors to measure a thermal conductivity-depth profile as it proceeds to depth. The heat flow is calculated from the product of the temperature gradient and the thermal conductivity. To avoid the perturbation caused by annual surface temperature variations, the measurements need to be taken at a depth between 3 m and 5 m. The mole is designed to penetrate cohesionless soil similar in rheology to quartz sand which is expected to provide a good analogue material for Martian sand. The sand would provide friction to the buried mole hull to balance the remaining recoil of the mole hammer mechanism that drives the mole forward. Unfortunately, the mole did not penetrate more than 40 cm, roughly a mole length. The failure to penetrate deeper is largely due to a cohesive duricrust of a few tens of centimeter thickness that failed to provide the required friction. Although a suppressor mass and spring as part of the mole hammer mechanism absorb much of the recoil, the available mass did not allow designing a system that fully eliminated the recoil. The mole penetrated to 40 cm depth benefiting from friction provided by springs in the support structure from which it was deployed and from friction and direct support provided by the InSight Instrument Deployment Arm. In addition, the Martian soil provided unexpected levels of penetration resistance that would have motivated designing a more powerful mole. The low weight of the mole support structure was not sufficient to guide the mole penetrating vertically. Roughly doubling the overall mass of the instrument package would have allowed to design a more robust system with little or no recoil, more energy of the mole hammer mechanism and a more massive support structure. In addition, to cope with duricrust a mechanism to support the mole to a depth of about two mole lengths should be considered.} } - Spohn, T., Hudson, T. L., Marteau, E., Golombek, M., Grott, M., Wippermann, T., Ali, K. S., Schmelzbach, C., Kedar, S., Hurst, K., Trebi-Ollennu, A., Krause, C. and Kroemer, O. (2022). The InSight HP3 Penetrator (Mole) on Mars: Soil Properties Derived From the Penetration Attempts and Related Activities
. Space Science Reviews. Source
BibTeX
@article{spohn2022insightb, title = {The InSight HP3 Penetrator (Mole) on Mars: Soil Properties Derived From the Penetration Attempts and Related Activities}, author = {Spohn, Tilman and Hudson, Troy L. and Marteau, Elodie and Golombek, Matthew and Grott, Matthias and Wippermann, Torben and Ali, Khaled S. and Schmelzbach, Cedric and Kedar, Sharon and Hurst, Kenneth and Trebi-Ollennu, Ashitey and Krause, Christian and Kroemer, Olaf}, journal = {Space Science Reviews}, volume = {218}, pages = {72}, year = {2022}, doi = {10.1007/s11214-022-00941-z}, abstract = {Abstract The NASA InSight Lander on Mars includes the Heat Flow and Physical Properties Package HP 3 to measure the surface heat flow of the planet. The package uses temperature sensors that would have been brought to the target depth of 3–5 m by a small penetrator, nicknamed the mole. The mole requiring friction on its hull to balance remaining recoil from its hammer mechanism did not penetrate to the targeted depth. Instead, by precessing about a point midway along its hull, it carved a 7 cm deep and 5–6 cm wide pit and reached a depth of initially 31 cm. The root cause of the failure – as was determined through an extensive, almost two years long campaign – was a lack of friction in an unexpectedly thick cohesive duricrust. During the campaign – described in detail in this paper – the mole penetrated further aided by friction applied using the scoop at the end of the robotic Instrument Deployment Arm and by direct support by the latter. The mole tip finally reached a depth of about 37 cm, bringing the mole back-end 1–2 cm below the surface. It reversed its downward motion twice during attempts to provide friction through pressure on the regolith instead of directly with the scoop to the mole hull. The penetration record of the mole was used to infer mechanical soil parameters such as the penetration resistance of the duricrust of 0.3–0.7 MPa and a penetration resistance of a deeper layer ( $>30~\text{cm}$ > 30 cm depth) of $4.9\pm0.4~\text{MPa}$ 4.9 ± 0.4 MPa . Using the mole’s thermal sensors, thermal conductivity and diffusivity were measured. Applying cone penetration theory, the resistance of the duricrust was used to estimate a cohesion of the latter of 2–15 kPa depending on the internal friction angle of the duricrust. Pushing the scoop with its blade into the surface and chopping off a piece of duricrust provided another estimate of the cohesion of 5.8 kPa. The hammerings of the mole were recorded by the seismometer SEIS and the signals were used to derive P-wave and S-wave velocities representative of the topmost tens of cm of the regolith. Together with the density provided by a thermal conductivity and diffusivity measurement using the mole’s thermal sensors, the elastic moduli were calculated from the seismic velocities. Using empirical correlations from terrestrial soil studies between the shear modulus and cohesion, the previous cohesion estimates were found to be consistent with the elastic moduli. The combined data were used to derive a model of the regolith that has an about 20 cm thick duricrust underneath a 1 cm thick unconsolidated layer of sand mixed with dust and above another 10 cm of unconsolidated sand. Underneath the latter, a layer more resistant to penetration and possibly containing debris from a small impact crater is inferred. The thermal conductivity increases from 14 mW/m K to 34 mW/m K through the 1 cm sand/dust layer, keeps the latter value in the duricrust and the sand layer underneath and then increases to 64 mW/m K in the sand/gravel layer below.} } - Rodriguez-Manfredi, J., de la Torre Juárez, M., Alonso, A., Apéstigue, V., Arruego, I., Atienza, T., Banfield, D., Boland, J., Carrera, M., Castañer, L., Ceballos, J., Chen-Chen, H., Cobos, A., Conrad, P. G., Cordoba, E. C., del Río-Gaztelurrutia, T., de Vicente-Retortillo, A., Domínguez-Pumar, M., Espejo, S., Fairen, A. G., Fernández-Palma, A., Ferrándiz, R., Ferri, F., Fischer, E., García-Manchado, A., García-Villadangos, M., Genzer, M., Giménez, S., Gómez-Elvira, J., Gómez, F., Guzewich, S. D., Harri, A.-M., Hernández, C., Hieta, M., Hueso, R., Jaakonaho, I., Jiménez, J., Jiménez, V., Larman, A., Leiter, R., Lepinette, A., Lemmon, M. T., López, G., Madsen, S., Mäkinen, T., Marín, M., Martín-Soler, J., Martínez, G., Molina, A., Mora-Sotomayor, L., Moreno-Álvarez, J., Navarro, S., Newman, C. E., Ortega, C., Parrondo, M., Peinado, V., Peña, A., Pérez-Grande, I., Pérez-Hoyos, S., Pla-García, J., Polkko, J., Postigo, M., Prieto-Ballesteros, O., Rafkin, S., Ramos, M., Richardson, M. I., Romeral, J., Romero, C., Runyon, K., Saiz-Lopez, A., Sánchez-Lavega, A., Sard, I., Schofield, J. T., Sebastian, E., Smith, M. D., Sullivan, R. J., Tamppari, L. K., Thompson, A. D., Toledo, D., Torrero, F., Torres, J., Urquí, R., Velasco, T., Viúdez-Moreiras, D., Zurita, S. and The MEDA team. (2021). The Mars Environmental Dynamics Analyzer, MEDA. A Suite of Environmental Sensors for the Mars 2020 Mission
. Space Science Reviews, 48. Source
BibTeX
@article{rodriguezmanfredi2021mars, title = {The Mars Environmental Dynamics Analyzer, MEDA. A Suite of Environmental Sensors for the Mars 2020 Mission}, author = {Rodriguez-Manfredi, J.A. and de la Torre Juárez, Manuel and Alonso, A. and Apéstigue, V. and Arruego, I. and Atienza, T. and Banfield, Don and Boland, J. and Carrera, M.A. and Castañer, L. and Ceballos, J. and Chen-Chen, H. and Cobos, A. and Conrad, Pamela G. and Cordoba, Elizabeth C. and del Río-Gaztelurrutia, T. and de Vicente-Retortillo, A. and Domínguez-Pumar, M. and Espejo, S. and Fairen, Alberto G. and Fernández-Palma, A. and Ferrándiz, Ricardo and Ferri, Francesca and Fischer, Erik and García-Manchado, A. and García-Villadangos, M. and Genzer, Maria and Giménez, S. and Gómez-Elvira, Javier and Gómez, F. and Guzewich, Scott D. and Harri, Ari-Matti and Hernández, C.D. and Hieta, M. and Hueso, Ricardo and Jaakonaho, I. and Jiménez, J.J. and Jiménez, V. and Larman, A. and Leiter, R. and Lepinette, A. and Lemmon, Mark T. and López, G. and Madsen, S.N. and Mäkinen, Teemu and Marín, M. and Martín-Soler, Javier and Martínez, G. and Molina, Antonio and Mora-Sotomayor, Luis and Moreno-Álvarez, J.F. and Navarro, Sara and Newman, Claire E. and Ortega, C. and Parrondo, M.C. and Peinado, V. and Peña, A. and Pérez-Grande, Isabel and Pérez-Hoyos, S. and Pla-García, Jorge and Polkko, Jouni and Postigo, M. and Prieto-Ballesteros, Olga and Rafkin, S.C.R. and Ramos, Miguel and Richardson, Mark I. and Romeral, J. and Romero, C. and Runyon, K.D. and Saiz-Lopez, A. and Sánchez-Lavega, Agustin and Sard, I. and Schofield, John T. and Sebastian, E. and Smith, Michael D. and Sullivan, Robert J. and Tamppari, Leslie K. and Thompson, Arthur D. and Toledo, D. and Torrero, F. and Torres, Josefina and Urquí, R. and Velasco, T. and Viúdez-Moreiras, Daniel and Zurita, S. and {The MEDA team}}, journal = {Space Science Reviews}, volume = {217}, number = {48}, pages = {48--48}, year = {2021}, doi = {10.1007/s11214-021-00816-9}, abstract = {Abstract NASA’s Mars 2020 (M2020) rover mission includes a suite of sensors to monitor current environmental conditions near the surface of Mars and to constrain bulk aerosol properties from changes in atmospheric radiation at the surface. The Mars Environmental Dynamics Analyzer (MEDA) consists of a set of meteorological sensors including wind sensor, a barometer, a relative humidity sensor, a set of 5 thermocouples to measure atmospheric temperature at ∼1.5 m and ∼0.5 m above the surface, a set of thermopiles to characterize the thermal IR brightness temperatures of the surface and the lower atmosphere. MEDA adds a radiation and dust sensor to monitor the optical atmospheric properties that can be used to infer bulk aerosol physical properties such as particle size distribution, non-sphericity, and concentration. The MEDA package and its scientific purpose are described in this document as well as how it responded to the calibration tests and how it helps prepare for the human exploration of Mars. A comparison is also presented to previous environmental monitoring payloads landed on Mars on the Viking, Pathfinder, Phoenix, MSL, and InSight spacecraft.} } - Bertrand, T., Wilson, R. J., Kahre, M. A., Urata, R. and Kling, A. (2020). Simulation of the 2018 Global Dust Storm on Mars Using the NASA Ames Mars GCM: A Multi-Tracer Approach
. Journal of Geophysical Research: Planets. Source
BibTeX
@article{bertrand2020simulation, title = {Simulation of the 2018 Global Dust Storm on Mars Using the NASA Ames Mars GCM: A Multi-Tracer Approach}, author = {Bertrand, Tanguy and Wilson, R. J. and Kahre, M. A. and Urata, R. and Kling, A.}, journal = {Journal of Geophysical Research: Planets}, volume = {125}, year = {2020}, doi = {10.1029/2019je006122}, abstract = {Abstract Global dust storms are the most thermodynamically significant dust events on Mars. The most recent of these events occurred in 2018. Although it was monitored by several spacecraft in orbit and on the surface, many questions remain regarding its onset, expansion and decay. Here, we model the 2018 event with the National Aeronautics and Space Administration (NASA) Ames Mars Global Climate Model in order to better understand the evolution of the storm. Our results highlight a mechanism for the expansion of the storm: the initial equatorial regional storm creates a zonal atmospheric temperature gradient causing strong equatorial eastward winds and thus rapid eastward transport of dust and subsequent lifting. The model shows rapid back and forth transfer of dust between western and eastern hemispheres reservoirs, which may also play an important role in the storm's development through teleconnections involving replenishment of surface dust. The model also shows that gigantic dust plumes occur during the storm's mature phase, injecting dust up to 80 km. Our analysis shows that their upward motion in the atmosphere is due to the ascending branches of Hadley cells, whose intensity is reinforced during the storm with increasing dustiness. We show that the global atmospheric warming during the storm cause vapor and water ice clouds to migrate to higher altitudes, in line with recent observations. Finally, we find that the choice of effective radius for the lifted dust particle size distribution impacts the intensity of the Hadley circulation and could explain some of the differences obtained between model results and observations.} } - Smith, C. L., Moores, J. E., Lemmon, M., Guzewich, S. D., Moore, C. A., Ellison, D. and Khayat, A. S. J. (2019). Visibility and Line-Of-Sight Extinction Estimates in Gale Crater during the 2018/MY34 Global Dust Storm
. Geophysical Research Letters. Source
BibTeX
@article{smith2019visibility, title = {Visibility and Line-Of-Sight Extinction Estimates in Gale Crater during the 2018/MY34 Global Dust Storm}, author = {Smith, Caroline L. and Moores, John E. and Lemmon, M. and Guzewich, Scott D. and Moore, C. A. and Ellison, D. and Khayat, A. S. J.}, journal = {Geophysical Research Letters}, volume = {46}, pages = {9414-9421}, year = {2019}, doi = {10.1029/2019gl083788}, abstract = {Abstract Northern line‐of‐sight extinction within Gale Crater during the 2018 global dust storm was monitored daily using Mars Science Laboratory's Navcam. Additional observations with Mastcam (north) and Navcam (all directions) were obtained at a lower cadence. Using feature identification and georeferencing, extinction was estimated in all possible directions. Peak extinction of >1.1 km −1 was measured between sols 2086 and 2090, an order of magnitude higher than previous maxima. Northern and western directions show an initial decrease, followed by a secondary peak in extinction, not seen in column opacity measurements. Due to foreground topography, eastern direction results are provided only as limits, and southern results were indeterminable. Mastcam red and green filter results agree well, but blue filter results show higher extinctions, likely due to low signal‐to‐noise. Morning results are systematically higher than afternoon results, potentially indicative of atmospheric mixing.} } - Ayoub, F., Avouac, J.-P., Newman, C. E., Richardson, M. I., Lucas, A., Leprince, S. and Bridges, N. T. (2014). Threshold for sand mobility on Mars calibrated from seasonal variations of sand flux
. Nature Communications. Source
BibTeX
@article{ayoub2014threshold, title = {Threshold for sand mobility on Mars calibrated from seasonal variations of sand flux}, author = {Ayoub, F. and Avouac, J.-P. and Newman, Claire E. and Richardson, Mark I. and Lucas, A. and Leprince, S. and Bridges, Nathan T.}, journal = {Nature Communications}, volume = {5}, pages = {5096}, year = {2014}, doi = {10.1038/ncomms6096} } - Banjac, S., Herbst, K. and Heber, B. (2019). Implementation and validation of the GEANT4/AtRIS code to model the radiation environment at Mars
. Journal of Space Weather and Space Climate. Source
BibTeX
@article{banjac2019implementation, title = {Implementation and validation of the GEANT4/AtRIS code to model the radiation environment at Mars}, author = {Banjac, S. and Herbst, K. and Heber, B.}, journal = {Journal of Space Weather and Space Climate}, volume = {9}, pages = {A2}, year = {2019}, doi = {10.1051/swsc/2018051}, abstract = {A new GEANT4 particle transport model – the Atmospheric Radiation Interaction Simulator (AtRIS, Banjac et al. 2018. J Geophys Res Space Phys 123 . https://doi.org/10.1029/2018JA026042 ) – has been recently developed in order to model the interaction of radiation with planets. The upcoming instrumentational advancements in the exoplanetary science, in particular transit spectroscopy capabilities of missions like JWST and E-ELT, have motivated the development of a particle transport code with a focus on providing the necessary flexibility in planet specification (atmosphere and soil geometry and composition, tidal locking, oceans, clouds, etc.) for the modeling of radiation environment for exoplanets. Since there are no factors limiting the applicability of AtRIS to Mars and Venus, AtRIS’ unique flexibility opens possibilities for new studies. Following the successful validation against Earth measurements (Banjac et al. 2018. J Geophys Res Space Phys 123 . https://doi.org/10.1029/2018JA026042 ), this work applies AtRIS with a specific implementation of the Martian atmospheric and regolith structure to model the radiation environment at Mars. We benchmark these first modeling results based on different GEANT4 physics lists with the energetic particle spectra recently measured by the Radiation Assessment Detector (RAD) on the surface of Mars. The good agreement between AtRIS and the actual measurement provides one of the first and sound validations of AtRIS and the preferred physics list which could be recommended for predicting the radiation field of other conceivable (exo)planets with an atmospheric environment similar to Mars.} } - Koning, W. J. F., Perez Perez, N., Cummings, H. V., Nagata, T., Kanzaki, Y., Kasai, M., Miyagi, M., Nonomura, T., Asai, K., Caros, L., Buxton, O. and Vincent, P. (2024). Experimental Results for Mars Rotorcraft Airfoils (roamx-0201 and clf5605) at Low Reynolds Number and Compressible Flow in a Mars Wind Tunnel
. NASA Ames Research Center, NASA/TM-20240004230. Source
BibTeX
@techreport{koning2024experimental, title = {Experimental Results for Mars Rotorcraft Airfoils (roamx-0201 and clf5605) at Low Reynolds Number and Compressible Flow in a Mars Wind Tunnel}, author = {Koning, Witold J. F. and Perez Perez, N. and Cummings, H. V. and Nagata, Taiichi and Kanzaki, Y. and Kasai, M. and Miyagi, M. and Nonomura, T. and Asai, K. and Caros, L. and Buxton, O. and Vincent, P.}, number = {NASA/TM-20240004230}, institution = {NASA Ames Research Center}, year = {2024}, url = {https://ntrs.nasa.gov/citations/20240004230}, abstract = {Experimental results are obtained for a roamx-0201 type airfoil and the clf5605 airfoil at highsubsonic, low Reynolds number conditions using the Tohoku University Mars Wind Tunnel, Japan. The tests are conducted at a Mach number of M = 0.60, and a Reynolds number of Re = 20,000 to reflect representative aerodynamics of a rotor blade for Mars exploration. The angle of attack is varied between α = −2.0 deg and α = 6.0 deg. The roamx-0201 type airfoil is an unconventional airfoil optimized for the chosen tunnel operating conditions using the Evolutionary aLgorithm for Iterative Studies of Aeromechanics (ELISA), developed under the Rotor Optimization for the Advancement of Mars eXploration (ROAMX) project. ELISA is utilized here to optimize aerodynamic airfoil performance using a Genetic Algorithm and two-dimensional high-fidelity CFD simulations, ultimately resulting in a Pareto-optimal airfoil set. The clf5605 airfoil is the outboard airfoil used on the Ingenuity Mars Helicopter and provides a baseline against which the roamx-0201, as well as possible future airfoil profiles for the compressible low Reynolds number regime, can be compared against. Lift and drag data are recorded using a balance, pressure distributions are obtained using Pressure Sensitive Paint (PSP) application, and Schlieren images are obtained to visualize the flowfield. The data is tabulated to aid future research.} } - Perez Perez, B. N., Cummings, H. V., Koning, W. J. F., Haddad, F. B., Romander, E. A., Johnson, W., Datta, A., Nagata, T., Asai, K., Nonomura, T., Caros Roca, L., Buxton, O. and Vincent, P. (2025). Novel Guidelines and Designs for Airfoils and Helicopter Blades for Mars Applications With Experimental Validation
. AIAA Sci Tech Forum. Source
BibTeX
@inproceedings{perezperez2025novel, title = {Novel Guidelines and Designs for Airfoils and Helicopter Blades for Mars Applications With Experimental Validation}, author = {Perez Perez, B. N. and Cummings, H. V. and Koning, Witold J. F. and Haddad, F. B. and Romander, Ethan A. and Johnson, Wayne and Datta, A. and Nagata, Taiichi and Asai, K. and Nonomura, T. and Caros Roca, L. and Buxton, O. and Vincent, P.}, booktitle = {AIAA Sci Tech Forum}, institution = {NASA Ames Research Center}, address = {Orlando, Florida}, year = {2025}, url = {https://ntrs.nasa.gov/citations/20250010782}, abstract = {The Rotor Optimization for the Advancement of Mars eXploration (ROAMX) project advances the design and validation of airfoils and blades for next-generation Mars rotorcraft. A comprehensive computational modeling and experimental campaign was conducted to address the unique low-density flight environment of Mars. An airfoil and rotor modeling and optimization framework tailored to Mars Reynolds and Mach number regimes was developed and applied to generate a portfolio of candidate geometries. A novel lift-generation mechanism was identified and experimentally validated, broadening the design space for airfoil and rotor performance. Airfoil performance was rigorously assessed through a combination of wind tunnel testing and high-fidelity computational fluid dynamics simulations under Mars representative flow conditions. Airfoil optimization resulted in airfoils that had a 25% increase in coefficient lift to drag ratio at the 75% radial station, compared to the clf5605 baseline airfoil (Ingenuity Mars Helicopter). A structural design methodology for Mars rotor blades was established and the strength of the rotor blades was verified via static pull testing at 110% of the centrifugal force experienced at a tip Mach number of 0.95. Facility enhancements at NASA Ames further expanded Mars rotorcraft testing capabilities, including the development of a state-of-the-art hover stand capable of high-accuracy performance measurements at very low pressure. Collectively, these efforts culminated in the demonstration of optimized rotor performance at Mars flight conditions, providing validated design tools, test infrastructure, and performance data to support future scientific and exploration rotorcraft missions on Mars. The full-scale ROAMX optimized rotor was tested and achieved a 29% increase in peak Figure of Merit, compared to the Ingenuity helicopter rotor, at the design density.} } - Hassler, D. M. and Norbury, J. W. (2017). Mars Science Laboratory Radiation Assessment Detector (MSL-RAD) Modeling Workshop Proceedings
. Life Sciences in Space Research. Source
BibTeX
@article{hassler2017mars, title = {Mars Science Laboratory Radiation Assessment Detector (MSL-RAD) Modeling Workshop Proceedings}, author = {Hassler, Donald M. and Norbury, John W.}, journal = {Life Sciences in Space Research}, volume = {14}, pages = {1-2}, institution = {NASA}, year = {2017}, doi = {10.1016/j.lssr.2017.06.004}, abstract = {The Radiation Assessment Detector (RAD) (Hassler et al., 2012) onboard the Mars Science Laboratory (MSL) Curiosity rover (Grotzinger et al., 2012) has been making detailed measurements of the radiation environment on the surface of Mars since landing on 6 August 2012 (Hassler et al., 2014; Zeitlin et al., 2016). These measurements are the first of their kind on the surface of another planet and are providing essential measurements of the radiation environment on Mars in preparation for a human mission in the coming decades. The objectives of RAD are; 1) to characterize the energetic particle spectrum on the surface of Mars as a function of time in the solar cycle, including direct (galactic cosmic rays and solar energetic particles) and indirect (neutrons, etc.) radiation created in the atmosphere and regolith, 2) to determine the dose and dose‐equivalent rates as a function of time in the solar cycle, and 3) to use these observations to test and validate space radiation transport models. Initial results of the charged particle spectra (Ehresmann et al., 2014) and neutral particle spectrum (Köhler et al., 2014), as well as dose and dose‐equivalent during cruise (Zeitlin et al., 2013) and on the surface (Hassler et al., 2014) have been reported, and with almost five years of continuous measurements, RAD continues to characterize the radiation environment as solar minimum is approached.} } - Bloshenko, A. D., Robinson, J. M., Colon, R. A. and Anchordoqui, L. A. (2021). Health threat from cosmic radiation during manned missions to Mars
. International Cosmic Ray Conference - PoS. Source
BibTeX
@inproceedings{bloshenko2021health, title = {Health threat from cosmic radiation during manned missions to Mars}, author = {Bloshenko, A. D. and Robinson, J. M. and Colon, R. A. and Anchordoqui, L. A.}, booktitle = {International Cosmic Ray Conference - PoS}, pages = {1317}, year = {2021}, doi = {10.22323/1.395.1317}, abstract = {Cosmic radiation is a critical factor for astronauts’ safety in the context of evaluating the prospect of future space exploration. The Radiation Assessment Detector (RAD) on board the Curiosity Rover launched by the Mars Scientific Laboratory mission collected valuable data to model the energetic particle radiation environment inside a spacecraft during travel from Earth to Mars, and is currently doing the same on the surface of Mars itself. The Martian Radiation Experiment (MARIE) on board the Mars Odyssey satellite provides estimates of the absorbed radiation dose in the martian orbit, which are predicted to be similar to the radiation dose on Mars’ surface. In combination, these data provide a reliable assessment of the radiation hazards for a manned mission to Mars. Using data from RAD and MARIE we reexamine the risks for a crew on a manned flight to Mars and discuss recent developments in space exploration.} } - NASA. (2020). Cross-Program Design Specification for Natural Environments (DSNE), Revision G
. NASA Marshall Space Flight Center. Source
BibTeX
@techreport{nasa2020cross, title = {Cross-Program Design Specification for Natural Environments (DSNE), Revision G}, author = {{NASA}}, institution = {NASA Marshall Space Flight Center}, year = {2020}, url = {https://ntrs.nasa.gov/citations/20200000867}, abstract = {The DSNE completes environment-related specifications for architecture, system-level, and lower-tier documents by specifying the ranges of environmental conditions that must be accounted for by NASA ESD Programs. To assure clarity and consistency, and to prevent requirements documents from becoming cluttered with extensive amounts of technical material, natural environment specifications have been compiled into this document. The intent is to keep a unified specification for natural environments that each Program calls out for appropriate application.} } - Justh, H. L., Dwyer Cianciolo, A. M. and Hoffman, J. (2021). Mars Global Reference Atmospheric Model (Mars-GRAM): User Guide
. NASA Marshall Space Flight Center. Source
BibTeX
@techreport{nasa2021marsb, title = {Mars Global Reference Atmospheric Model (Mars-GRAM): User Guide}, author = {Justh, Hilary L. and Dwyer Cianciolo, Alicia M. and Hoffman, J.}, institution = {NASA Marshall Space Flight Center}, year = {2021}, url = {https://ntrs.nasa.gov/citations/20210023957}, abstract = {This Technical Memorandum (TM) presents the Mars Global Reference Atmospheric Model (Mars-GRAM) and the updated features of the GRAMs. Mars-GRAM is an engineering-oriented atmospheric model that estimates mean values and statistical variations of atmospheric properties for Mars. This TM summarizes the atmospheric data model in Mars-GRAM and provides a guide for the user to obtain, set up, and run the code in various configurations. Additional details regarding the Mars-GRAM input and output files and how to interpret Mars-GRAM results are also provided.} } - Castilla-Arquillo, R., Mandow, A., Pérez-del-Pulgar, C. J., Álvarez-Llamas, C., Vadillo, J. M. and Laserna, J. (2024). Thermal Imagery for Rover Soil Assessment Using a Multipurpose Environmental Chamber Under Simulated Mars Conditions
. IEEE Transactions on Instrumentation and Measurement. Source
BibTeX
@article{castillaarquillo2024thermal, title = {Thermal Imagery for Rover Soil Assessment Using a Multipurpose Environmental Chamber Under Simulated Mars Conditions}, author = {Castilla-Arquillo, Raúl and Mandow, Anthony and Pérez-del-Pulgar, Carlos J. and Álvarez-Llamas, César and Vadillo, José M. and Laserna, Javier}, journal = {IEEE Transactions on Instrumentation and Measurement}, volume = {73}, pages = {1-12}, publisher = {Institute of Electrical and Electronics Engineers (IEEE)}, year = {2024}, doi = {10.1109/tim.2023.3346528}, abstract = {Planetary rover missions on Mars have suffered entrapments and serious mobility incidents due to soil assessment limitations of stereo RGB cameras, which cannot characterize relevant physical phenomena such as thermal behavior that depend on granularity and cohesion. In particular, thermal inertia estimations are already being used to assess geophysical properties from one-dimensional low-resolution measurements by onboard thermopiles. However, no high-resolution measurements are currently available to characterize Martian soils for safer navigation in future missions, so new experimental methods are required to capture and analyze thermal images with planetary conditions in Earth-based experiments. In this work, we propose a novel measurement system configuration and experimental methodology to capture thermal images using isolated multipurpose environmental chambers to replicate the temperature and pressure conditions of Mars. Furthermore, the system has allowed to measure diurnal cycles for four soil types of known physical characteristics under Martian and Earth pressures to perform a unique quantitative analysis and comparison of thermal behavior and thermal inertia for soil assessment. Even if no actual Martian infrared (IR) images are available for comparison, results indicate a correlation between granularity and thermal inertia that is consistent with available thermopile measurements recorded by rovers onsite. Furthermore, the set of measurements acquired in the experiments has been made available to the scientific community.} } - Vasavada, A. R., Chen, A., Barnes, J. R., Burkhart, P. D., Cantor, B. A., Dwyer-Cianciolo, A. M., Fergason, R. L. and Hinson, D. P. (2012). Assessment of Environments for Mars Science Laboratory Entry, Descent, and Surface Operations
. Space Science Reviews. Source
BibTeX
@article{vasavada2012assessment, title = {Assessment of Environments for Mars Science Laboratory Entry, Descent, and Surface Operations}, author = {Vasavada, A. R. and Chen, Allen and Barnes, J. R. and Burkhart, P. Daniel and Cantor, B. A. and Dwyer-Cianciolo, Alicia M. and Fergason, R. L. and Hinson, D. P.}, journal = {Space Science Reviews}, volume = {170}, pages = {793-835}, year = {2012}, doi = {10.1007/978-1-4614-6339-9_21} } - Callas, J. L., Golombek, M. P. and Fraeman, A. A. (2019). Mars Exploration Rover Opportunity End of Mission Report
. Jet Propulsion Laboratory, California Institute of Technology, JPL Publication 19-10. Source
BibTeX
@techreport{callas2019mars, title = {Mars Exploration Rover Opportunity End of Mission Report}, author = {Callas, John L. and Golombek, Matthew P. and Fraeman, Abigail A.}, number = {JPL Publication 19-10}, publisher = {JPL Open Repository}, institution = {Jet Propulsion Laboratory, California Institute of Technology}, year = {2019}, url = {https://dataverse.jpl.nasa.gov/dataset.xhtml?persistentId=hdl:2014/47103} } - Edmondson, K. M., Joslin, D. E., Fetzer, C. M., King, R. R., Karam, N. H., Mardesich, N., Stella, P. M., Rapp, D. and Mueller, R. (2005). Simulation of the Mars surface solar spectra for optimized performance of triple junction solar cells
. SPRAT Conference. Source
BibTeX
@inproceedings{edmondson2005simulation, title = {Simulation of the Mars surface solar spectra for optimized performance of triple junction solar cells}, author = {Edmondson, Kenneth M. and Joslin, David E. and Fetzer, Chris M. and King, Richard R. and Karam, Nasser H. and Mardesich, Nick and Stella, Paul M. and Rapp, Donald and Mueller, Robert}, booktitle = {SPRAT Conference}, year = {2005}, url = {https://ntrs.nasa.gov/citations/20060042951}, abstract = {The unparalleled success of the Mars Exploration Rovers (MER) powered by GaInP/GaAs/Ge triple-junction solar cells has demonstrated a lifetime for the rovers that exceeded the baseline mission duration by more than a factor of five.} } - Horne, W. D., Hastrup, R. and Cesarone, R. (1997). Telecommunications for Mars Rovers and Robotic Missions
. AIAA ASCEND. Source
BibTeX
@inproceedings{horne1997telecommunicationsa, title = {Telecommunications for Mars Rovers and Robotic Missions}, author = {Horne, W. D. and Hastrup, Rolf and Cesarone, R.}, booktitle = {AIAA ASCEND}, publisher = {JPL Open Repository}, year = {1997}, url = {https://dataverse.jpl.nasa.gov/dataset.xhtml?persistentId=hdl:2014/21726} } - Rankin, A., Maimone, M., Biesiadecki, J., Patel, N., Levine, D. and Toupet, O. (2021). Mars Curiosity Rover Mobility Trends During the First Seven Years
. Journal of Field Robotics, 5. Source
BibTeX
@article{rankin2021mars, title = {Mars Curiosity Rover Mobility Trends During the First Seven Years}, author = {Rankin, Arturo and Maimone, Mark and Biesiadecki, Jeffrey and Patel, Nikunj and Levine, Dan and Toupet, Olivier}, journal = {Journal of Field Robotics}, volume = {38}, number = {5}, pages = {759--800}, year = {2021}, doi = {10.1002/rob.22011}, abstract = {Abstract NASA's Mars Science Laboratory (MSL) Curiosity rover landed on Mars on August 6, 2012. In the 7 years between landing and August 6, 2019 (sol 2488), Curiosity has driven 21,318.5 m over a variety of terrain types and slopes, employing multiple drive modes with varying amounts of onboard autonomy. Curiosity's drive distances each sol have ranged from its shortest drive of 2.6 cm to its longest drive of 142.5 m, with an average drive distance of 28.9 m. Real‐time human intervention is not possible during Curiosity's drives due to the latency in uplinking commands and downlinking telemetry. Instead, the operations team relies on Curiosity's fault protection, autonomous navigation, and visual odometry software to keep the rover safe during drives. During its first 7 years on Mars, Curiosity has attempted 738 drives. While 622 drives ran to completion, 116 drives were prevented or stopped early by Curiosity's fault protection software. The primary risks to mobility success have been wheel damage, wheel entrapment, progressive wheel sinkage, and the potential for hardware or cable failures that result in an inability to command one or more steer or drive actuators. In this paper, we describe Curiosity's mobility subsystem, mobility trends over the first 21.3 km of the mission, operational aspects of mobility fault protection, risks to continued mobility success, and risk mitigation strategies.} } - Bonitz, R., Shiraishi, L., Robinson, M., Carsten, J., Volpe, R., Trebi-Ollennu, A., Arvidson, R. E., Chu, P. C., Wilson, J. J. and Davis, K. R. (2009). The Phoenix Mars Lander Robotic Arm
. IEEE Aerospace Conference. Source
BibTeX
@inproceedings{bonitz2009phoenix, title = {The Phoenix Mars Lander Robotic Arm}, author = {Bonitz, Robert and Shiraishi, Lori and Robinson, Matthew and Carsten, Joseph and Volpe, Richard and Trebi-Ollennu, Ashitey and Arvidson, Raymond E. and Chu, P. C. and Wilson, J. J. and Davis, K. R.}, booktitle = {IEEE Aerospace Conference}, pages = {1-12}, organization = {Jet Propulsion Laboratory, California Institute of Technology}, address = {Big Sky, Montana}, year = {2009}, doi = {10.1109/aero.2009.4839306}, abstract = {The Phoenix Mars Lander Robotic Arm (RA) has operated for 149 sols since the Lander touched down on the north polar region of Mars on May 25, 2008. During its mission it has dug numerous trenches in the Martian regolith, acquired samples of Martian dry and icy soil, and delivered them to the Thermal Evolved Gas Analyzer (TEGA) and the Microscopy, Electrochemistry, and Conductivity Analyzer (MECA). The RA inserted the Thermal and Electrical Conductivity Probe (TECP) into the Martian regolith and positioned it at various heights above the surface for relative humidity measurements. The RA was used to point the Robotic Arm Camera to take images of the surface, trenches, samples within the scoop, and other objects of scientific interest within its workspace. Data from the RA sensors during trenching, scraping, and trench cave-in experiments have been used to infer mechanical properties of the Martian soil. This paper describes the design and operations of the RA as a critical component of the Phoenix Mars Lander necessary to achieve the scientific goals of the mission.} } - Chien, S. A., Visentin, G. and Basich, C. (2024). Exploring Beyond Earth using Space Robotics: Update
. Science Robotics. Source
BibTeX
@article{chien2024exploring, title = {Exploring Beyond Earth using Space Robotics: Update}, author = {Chien, Steve A. and Visentin, Gianfranco and Basich, Connor}, journal = {Science Robotics}, publisher = {JPL Open Repository}, year = {2024}, doi = {10.48577/jpl.2ezlhn}, abstract = {Robotic spacecraft enable exploration of our solar system, beyond our human presence. While spacecraft have explored every planet in the solar system, the frontiers of space robotics are at the cutting edge of landers, rovers, and now atmospheric explorers where robotic spacecraft must interact intimately with their environment to explore beyond the reach of flyby and orbital remote sensing.In 2017, we surveyed space robotics - telling the rich history of robotic explorers to the Moon, Mars, and beyond. In this article, we describe the tremendous growth in space robotics missions in the period 2017-2024 with many new entities participating in missions to the surface of the Moon, Mars, and beyond. We also describe the recent development of aerial missions to planets and moons as exemplified by the Ingenuity helicopter on Mars, the Dragonfly mission to Titan, and the planned Sample Recovery Helicopter to Mars. As with the 2017 survey, we seek to provide a big picture of developments and directions in space robotics. Additionally, we focus on sub orbital robotics - landers, rovers, and aerial vehicles, with associated challenges in sensing, manipulation, and mobility.} } - Siddiqi, A. A. (2018). Beyond Earth: A Chronicle of Deep Space Exploration, 1958-2016
. NASA, NASA SP-2018-4041. Source
BibTeX
@book{siddiqi2018beyond, title = {Beyond Earth: A Chronicle of Deep Space Exploration, 1958-2016}, author = {Siddiqi, Asif A.}, number = {NASA SP-2018-4041}, publisher = {NASA}, year = {2018}, url = {https://www.nasa.gov/wp-content/uploads/2018/09/beyond-earth-tagged.pdf} } - Wenkert, D., Gladden, R. E., Edwards, C. D., Schmitz, P., Denis, M. and Winton, A. J. (2016). Enabling International Data Relay at Mars
. SpaceOps Conference. Source
BibTeX
@inproceedings{wenkert2016enabling, title = {Enabling International Data Relay at Mars}, author = {Wenkert, Daniel and Gladden, Roy. E. and Edwards, Charles D. and Schmitz, Peter and Denis, Michel and Winton, Alistair J.}, booktitle = {SpaceOps Conference}, publisher = {American Institute of Aeronautics and Astronautics}, year = {2016}, doi = {10.2514/6.2016-2355} } - National Research Council, C. O. T. P. S. D. S. (2011). Vision and Voyages for Planetary Science in the Decade 2013-2022
. The National Academies Press, Washington, DC. Source
BibTeX
@techreport{nrc2011vision, title = {Vision and Voyages for Planetary Science in the Decade 2013-2022}, author = {{National Research Council, Committee on the Planetary Science Decadal Survey}}, institution = {The National Academies Press, Washington, DC}, year = {2011}, doi = {10.17226/13117}, abstract = {Research priorities were selected through a rigorous review that included input from five expert panels. The committee also sought extensive input from the planetary sciences community through town hall meetings and white papers. Recommendations are informed by NASA's own FY 2011 projected budget scenarios for 2013-2022. In addition, the committee hired a contractor to provide independent cost and technical analyses of select mission proposals. "Our recommendations are science-driven, and they offer a balanced mix of missions -- large, medium, and small -- that have the potential to greatly expand our knowledge of the solar system," said Steven W. Squyres, professor of astronomy at the Center for Radiophysics and Space Research, Cornell University, Ithaca, N.Y., and chair of the committee that wrote the report. "However, in these tough economic times, some difficult choices may have to be made. With that in mind, our priority missions were carefully selected based on their potential to yield the most scientific benefit per dollar spent."} } - Cohen, B. (2008). Mars Exploration Rover Mission
. Leadership in Science and Technology: A Reference Handbook. doi.org/10.4135/9781412994231.n72
BibTeX
@misc{cohen2008mars,
  title = {Mars Exploration Rover Mission},
  author = {Cohen, Barbara},
  booktitle = {Leadership in Science and Technology: A Reference Handbook},
  pages = {636-643},
  year = {2008},
  doi = {10.4135/9781412994231.n72},
  abstract = {This viewgraph presentation reviews the Mars Exploration Rover Mission. The design of the Rover along with the Athena science payload is also described. Photographs of the Gusev Crater and Meridiani rocks are also shown.}
}